Holiday Inn 2015 Annual Report Download - page 77
Download and view the complete annual report
Please find page 77 of the 2015 Holiday Inn annual report below. You can navigate through the pages in the report by either clicking on the pages listed below, or by using the keyword search tool below to find specific information within the annual report.-
 1
1 -
2
-
3
-
4
-
5
-
6
-
7
-
8
-
9
-
10
-
11
-
12
-
13
-
14
-
15
-
16
-
17
-
18
-
19
-
20
-
21
-
22
-
23
-
24
-
25
-
26
-
27
-
28
-
29
-
30
-
31
-
32
-
33
-
34
-
35
-
36
-
37
-
38
-
39
-
40
-
41
-
42
-
43
-
44
-
45
-
46
-
47
-
48
-
49
-
50
-
51
-
52
-
53
-
54
-
55
-
56
-
57
-
58
-
59
-
60
-
61
-
62
-
63
-
64
-
65
-
66
-
 67
67 -
 68
68 -
 69
69 -
 70
70 -
 71
71 -
 72
72 -
 73
73 -
 74
74 -
 75
75 -
 76
76 -
 77
77 -
 78
78 -
 79
79 -
 80
80 -
 81
81 -
 82
82 -
 83
83 -
 84
84 -
 85
85 -
 86
86 -
 87
87 -
88
-
89
-
90
-
91
-
92
-
93
-
94
-
95
-
96
-
97
-
98
-
99
-
100
-
101
-
102
-
103
-
104
-
105
-
106
-
107
-
108
-
109
-
110
-
111
-
112
-
113
-
114
-
115
-
116
-
117
-
118
-
119
-
120
-
121
-
122
-
123
-
124
-
125
-
126
-
127
-
128
-
129
-
130
-
131
-
132
-
133
-
134
-
135
-
136
-
137
-
138
-
139
-
140
-
141
-
142
-
143
-
144
-
145
-
146
-
147
-
148
-
149
-
150
-
151
-
152
-
153
-
154
-
155
-
156
-
157
-
158
-
159
-
160
-
161
-
162
-
163
-
164
-
165
-
166
-
167
-
168
-
169
-
170
-
171
-
172
-
173
-
174
-
175
-
176
-
177
-
178
-
179
-
180
-
181
-
182
-
183
-
184
 |
 |

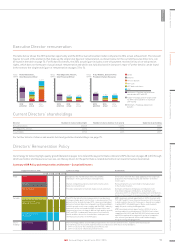
Statement of Directors’ shareholdings and share interests
The Committee believes that share ownership by Executive
Directors and senior executives strengthens the link between
the individual’s personal interests and those of shareholders.
Guideline Executive Director shareholding requirement
Executive Directors are required to hold shares equal to 300%
of salary for the Chief Executive Officer and 200% for others,
and are expected to hold all shares (net of share sales required
to meet tax) until this is achieved. The number of shares held
outright includes all Directors’ beneficial interests and those held
by their spouses and other connected persons. The APP deferred
share awards are not subject to performance conditions. Details
on the performance conditions to which the unvested LTIP awards
are still subject can be found on page 70. We do not consider
it necessary at this time to require a further holding period.
Percentages are calculated using the number of shares held
outright and the 31 December 2015 share price of 2,658p.
Shares and awards held by Executive Directors
as at 31 December 2015: % of salary
% of salary
Shares held outright Total shares and awards Guideline shareholding
224 1,215
631 1,824
127 867
1,227 2,203
300
200
Richard Solomons
Paul Edgecliffe-Johnson
Kirk Kinsell
Tracy Robbins
2,500
2,0001,5001,000500
0
Shares and awards held by Executive Directors as at
31 December 2015: number of shares
Executive
Director
Number
of shares
held outright
APP
deferred
share awards
LTIP
share awards
(unvested)
Total number
of shares and
awards held
2015 2014 2015 2014 2015 2014 2015 2014
Richard
Solomons
365,625 382,533 71,552 81,24 0 219,320 262,234 656,497 726,007
Paul
Edgecliffe-
Johnson
22,014 10,583 19,821 12,860 108,219 102,223 150,054 125,666
Kirk
Kinsell
117,640a117,6 4 0b49,580 49,580 172,938 172,938 340,158 340,158
Tracy
Robbins
37,726 51,418 41,808 48,932 125,168 150,041 204,702 250,391
a For 2015, the shareholdings shown for Mr Kinsell are as at his date of departure
from IHG on 13 February 2015.
b Comprised 117,092 ordinary shares and 548 American Depositary Receipts.
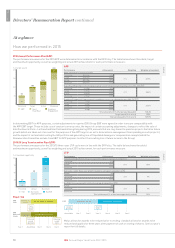
Chief Executive Officer’s remuneration
The table below shows the Chief Executive Officer’s single figure of total
remuneration for the seven years to 31 December 2015. For Richard
Solomons, the 2014 figure includes a one-off cash payment in respect
of pension entitlements which was fully explained in last year’s report.
Single figure
£000
Annual incentive
received (% of
maximum)
Shares received
under the LTIP
(% of maximum)
2015 Richard Solomons 3,199 75.0 50.0
2014 Richard Solomons 6,528 74.0 56.1
2013 Richard Solomons 3,149 74.0 59.0
2012 Richard Solomons 4,881 68.0 100.0
2011 Richard Solomons
Andrew Cosslett
4,724
3,770
83.0
43.0
73.9
61.6
2010 Andrew Cosslett 5,430 100.0 73.8
2009 Andrew Cosslett 1,953 0 46.0
Audited
Percentage change in remuneration of Chief Executive Officer
The table below shows the percentage change in the remuneration
of the Chief Executive Officer compared with UK employees between
2014 and 2015. We believe that a group comprised of UK-based
employees is an appropriate comparator for salary and taxable
benefits because the structure and composition of remuneration for
that group most closely reflects that of the UK-based Chief Executive
Officer. Therefore, the same UK market dynamics will apply to salary
movements providing for a better like-for-like comparison.
The salary figure for the UK employee population has been calculated
using the 2015 budget for the annual pay review taking into account
any promotions/marked adjustments made during the year. The
taxable benefits figure is based on P11D taxable benefits for tax year
ending 5 April in the relevant year. For the UK employee population,
this increase was due to a significant increase in the cost of healthcare
cover during the year.
For the annual incentive, a group of global executives, who sit directly
below Executive Committee level, is used as a comparator group as
they are subject to the same performance measures as the Chief
Executive Officer.
Chief Executive Officer UK employees
Salary +3.5% +3.0%
Taxable benefits +3.3% +60.6%
Annual incentive +5.2% +4.8%
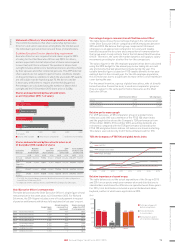
Relative performance graph
For LTIP purposes, a TSR comparator group of a global hotels
index was used. IHG was a member of the FTSE 100 share index
and the graph below shows the Company’s TSR performance from
31 December 2008 to 31 December 2015, assuming dividends are
reinvested, compared with the TSR performance achieved by the
FTSE 100 and global hotels indices. All indices are shown in sterling.
This data is sourced directly from Thomson Datastream for IHG.
TSR: the Company vs FTSE 100 and global hotels index
100
200
300
400
500
600
700
2008 2009 2010 2011 2012 2013 2014 2015
IHG PLC
Global hotels index
FTSE 100 index
Relative importance of spend on pay
The table below sets out the actual expenditure of the Group in 2015
and 2014 on corporate employee remuneration and distributions to
shareholders and shows the difference in spend between those years.
For 2014, total distributions included a special dividend and share
buyback, neither of which were applicable in 2015.
Total operating profit
before exceptionals
Remuneration paid to
all corporate employees
Total distributions
to shareholders
1,200
1,000
400
600
800
200
0
680 651
188
1,052
628 657
($m)
2014 2014
+ 4.5% – 82.1% – 4.4%
2015 2015 2015 2014
STRATEGIC REPORT GOVERNANCE GROUP FINANCIAL STATEMENTS ADDITIONAL INFORMATIONPARENT COMPANY FINANCIAL STATEMENTS
75IHG Annual Report and Form 20-F 2015