Holiday Inn 2015 Annual Report Download - page 46
Download and view the complete annual report
Please find page 46 of the 2015 Holiday Inn annual report below. You can navigate through the pages in the report by either clicking on the pages listed below, or by using the keyword search tool below to find specific information within the annual report.-
 1
1 -
2
-
3
-
4
-
5
-
6
-
7
-
8
-
9
-
10
-
11
-
12
-
13
-
14
-
15
-
16
-
17
-
18
-
19
-
20
-
21
-
22
-
23
-
24
-
25
-
26
-
27
-
28
-
29
-
30
-
31
-
32
-
33
-
34
-
35
-
 36
36 -
 37
37 -
 38
38 -
 39
39 -
 40
40 -
 41
41 -
 42
42 -
 43
43 -
 44
44 -
 45
45 -
 46
46 -
 47
47 -
 48
48 -
 49
49 -
 50
50 -
 51
51 -
 52
52 -
 53
53 -
 54
54 -
 55
55 -
 56
56 -
57
-
58
-
59
-
60
-
61
-
62
-
63
-
64
-
65
-
66
-
67
-
68
-
69
-
70
-
71
-
72
-
73
-
74
-
75
-
76
-
77
-
78
-
79
-
80
-
81
-
82
-
83
-
84
-
85
-
86
-
87
-
88
-
89
-
90
-
91
-
92
-
93
-
94
-
95
-
96
-
97
-
98
-
99
-
100
-
101
-
102
-
103
-
104
-
105
-
106
-
107
-
108
-
109
-
110
-
111
-
112
-
113
-
114
-
115
-
116
-
117
-
118
-
119
-
120
-
121
-
122
-
123
-
124
-
125
-
126
-
127
-
128
-
129
-
130
-
131
-
132
-
133
-
134
-
135
-
136
-
137
-
138
-
139
-
140
-
141
-
142
-
143
-
144
-
145
-
146
-
147
-
148
-
149
-
150
-
151
-
152
-
153
-
154
-
155
-
156
-
157
-
158
-
159
-
160
-
161
-
162
-
163
-
164
-
165
-
166
-
167
-
168
-
169
-
170
-
171
-
172
-
173
-
174
-
175
-
176
-
177
-
178
-
179
-
180
-
181
-
182
-
183
-
184
 |
 |
Performance continued
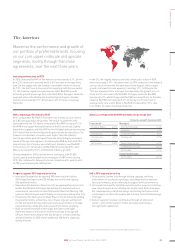
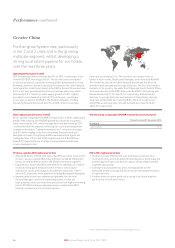
IHG’s 2016 regional priorities
1. Further increase IHG System size, with deeper penetration in
tier 2 and 3 cities and strengthen the distribution of the Holiday Inn
and Holiday Inn Express brands to capture the growing midscale
segment opportunity.
2. Continue to build awareness and a strong pipeline for the
HUALUXE brand (see page 20) and drive operational performance
of opened hotels.
3. Further grow our talent and build a strong local talent pipeline,
particularly in tier 2 and 3 cities.
Further grow System size, particularly
in tier 2 and 3 cities and in the growing
midscale segment, whilst developing a
strong local talent pipeline for our hotels,
over the next three years.
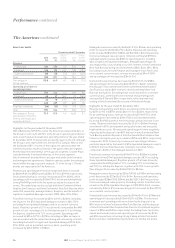
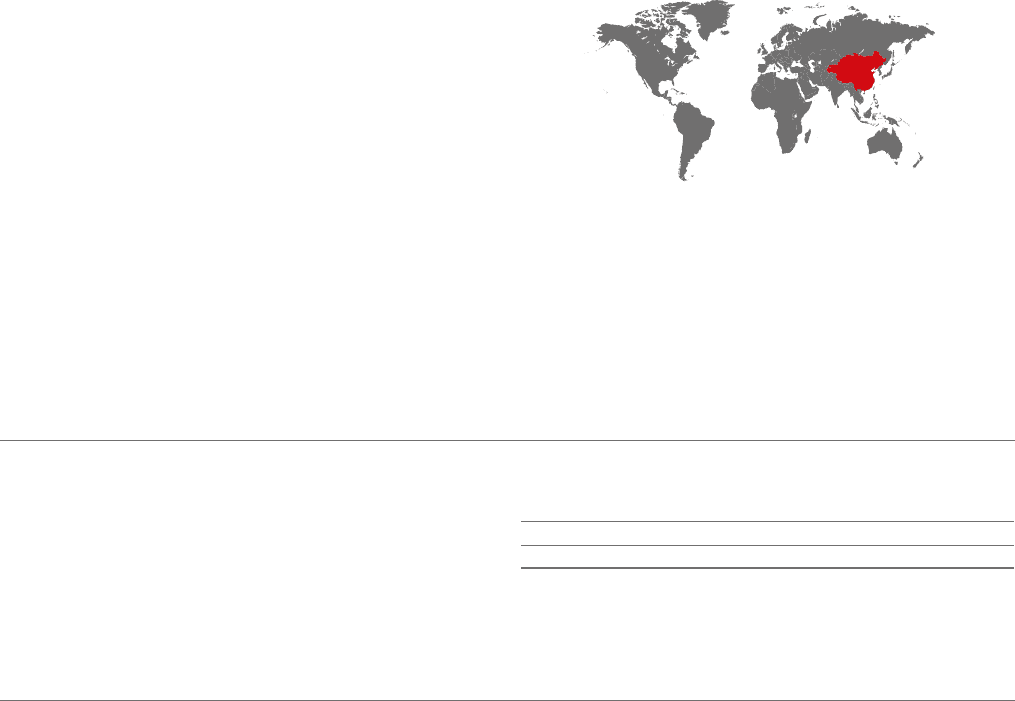
Greater China
Greater China comparable RevPAR movement on previous year
12 months ended 31December2015
Managed
All brands 1.1%
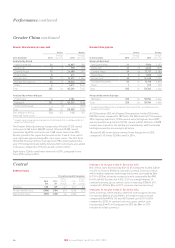
Industry performance in 2015
GDP in mainland China increased by 6.9% in 2015, continuing to slow
from the 2010-2014 average of 8.6%. The decline can be attributed
to decreased exports caused by slowing global demand and a strong
Renminbi; however, private consumption remains solid, which helped
to mitigate this trend. Hotel industry RevPAR in Greater China declined
3.4% in the year, predominately driven by average daily rate, which
declined by 3.3%. Industry rooms supply growth of 4.0% slightly
exceeded rooms demand growth of 3.9% in the year, resulting in
an occupancy decline. RevPAR in the People’s Republic of China
(excluding Taiwan) decreased by 3.5% in 2015, driven by average
Progress against 2015 regional priorities
• Opened 32 hotels in 2015, with more than 90% of rooms in tier 2 and
3 cities – we also signed 28 Holiday Inn Express and 20 Holiday Inn
hotels, driving further growth in the Chinese midscale segment.
• Expanded our new HUALUXE brand with three openings, all of which
received strong guest feedback both in terms of overall guest
satisfaction scores and ratings from external review sites – there
are now 21 properties in the pipeline (including Beijing and Shanghai).
• Implemented a talent secondment programme for our hotel
General Managers and hotel leadership teams, so that our
high-potential talent can learn best practices from high-performing
hotels. 39 IHG Academy programmes were completed in 2015,
helping to enhance our local talent pipeline.
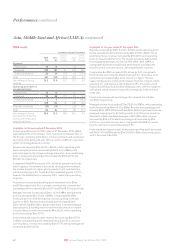
IHG’s regional performance in 2015
IHG’s regional comparable RevPAR increased 0.3% in 2015, significantly
ahead of the industry. Our RevPAR growth was driven by occupancy,
which increased by 3.4%, whilst average daily rate decreased by 3.0%
– both better than the industry, reflecting our scale and management
strength in the region. Trading in mainland tier 1 cities was strongest,
up 6.0% whilst trading in the rest of mainland China showed only
marginal increases. Hong Kong and Macau experienced significant
trading declines of 9.4% and 12.8% respectively. Total RevPAR was
down 2.3% impacted by our strategy of using mainstream brands
in less-developed cities.
daily rate declining by 3.4%. The country’s two largest cities in
terms of hotel rooms, Beijing and Shanghai, both increased RevPAR.
The former increased on robust demand growth and the latter on
growth in both demand and average daily rate. The two other largest
markets in the country, the wider East China and South Central China,
both saw a decline in RevPAR in the year. RevPAR in Hong Kong and
Macau declined by 11.5% and 13.7% respectively, both driven by
declines in average daily rate and demand. In Hong Kong, average
daily rate and demand decreased by 8.8% and 2.4% respectively,
whilst Macau average daily rate and demand decreased by 8.6%
and 0.3% respectively.
Source: Smith Travel Research for all of the above industry facts.
44 IHG Annual Report and Form 20-F 2015