Holiday Inn 2015 Annual Report Download - page 117
Download and view the complete annual report
Please find page 117 of the 2015 Holiday Inn annual report below. You can navigate through the pages in the report by either clicking on the pages listed below, or by using the keyword search tool below to find specific information within the annual report.-
 1
1 -
2
-
3
-
4
-
5
-
6
-
7
-
8
-
9
-
10
-
11
-
12
-
13
-
14
-
15
-
16
-
17
-
18
-
19
-
20
-
21
-
22
-
23
-
24
-
25
-
26
-
27
-
28
-
29
-
30
-
31
-
32
-
33
-
34
-
35
-
36
-
37
-
38
-
39
-
40
-
41
-
42
-
43
-
44
-
45
-
46
-
47
-
48
-
49
-
50
-
51
-
52
-
53
-
54
-
55
-
56
-
57
-
58
-
59
-
60
-
61
-
62
-
63
-
64
-
65
-
66
-
67
-
68
-
69
-
70
-
71
-
72
-
73
-
74
-
75
-
76
-
77
-
78
-
79
-
80
-
81
-
82
-
83
-
84
-
85
-
86
-
87
-
88
-
89
-
90
-
91
-
92
-
93
-
94
-
95
-
96
-
97
-
98
-
99
-
100
-
101
-
102
-
103
-
104
-
105
-
106
-
 107
107 -
 108
108 -
 109
109 -
 110
110 -
 111
111 -
 112
112 -
 113
113 -
 114
114 -
 115
115 -
 116
116 -
 117
117 -
 118
118 -
 119
119 -
 120
120 -
 121
121 -
 122
122 -
 123
123 -
 124
124 -
 125
125 -
 126
126 -
 127
127 -
128
-
129
-
130
-
131
-
132
-
133
-
134
-
135
-
136
-
137
-
138
-
139
-
140
-
141
-
142
-
143
-
144
-
145
-
146
-
147
-
148
-
149
-
150
-
151
-
152
-
153
-
154
-
155
-
156
-
157
-
158
-
159
-
160
-
161
-
162
-
163
-
164
-
165
-
166
-
167
-
168
-
169
-
170
-
171
-
172
-
173
-
174
-
175
-
176
-
177
-
178
-
179
-
180
-
181
-
182
-
183
-
184
 |
 |

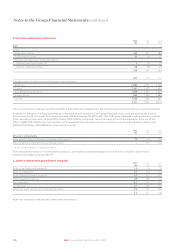
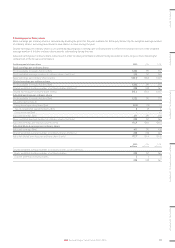
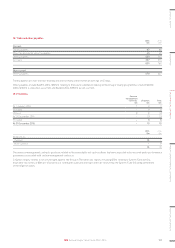
12. Property, plant and equipment continued
The table below analyses the net book value of the Group’s property, plant and equipment by operating segment at 31 December 2015:
Americas
$m
Europe
$m
AMEA
$m
Greater
China
$m
Central
$m
Total
$m
Land and buildings 288–––15303
Fixtures, fittings and equipment 40 – 10 – 75 125
328 – 10 – 90 428
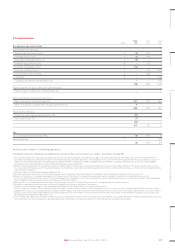
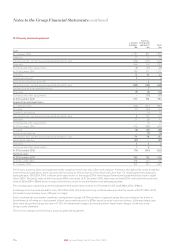
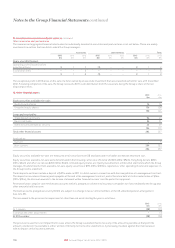
13. Goodwill and other intangible assets
Goodwill
$m
Brands
$m
Software
$m
Management
contracts
$m
Other
intangibles
$m
Total
$m
Cost
At 1 January 2014 221 – 395 277 159 1,052
Additions ––1085055213
Disposals – – (31) – (5) (36)
Exchange and other adjustments (6) – (1) (17) (2) (26)
At 31 December 2014 215 – 471 310 207 1,203
Additions ––949764255
Capitalised interest ––2 ––2
Acquisition of business (note 10) 167 193 2 71 – 433
Reclassification to property, plant and equipment ––(7)––(7)
Disposals – – (62) – (4) (66)
Exchange and other adjustments (11) – (2) (13) (4) (30)
At 31 December 2015 371 193 498 465 263 1,790
Amortisation and impairment
At 1 January 2014 (141) – (189) (131) (73) (534)
Provided – – (33) (9) (11) (53)
System Fund expense – – (15) – – (15)
Disposals ––31–435
Exchange and other adjustments – – (1) 6 2 7
At 31 December 2014 (141) – (207) (134) (78) (560)
Provided – – (40) (10) (11) (61)
System Fund expense ––(18)––(18)
Disposals ––62 –365
Exchange and other adjustments 3–1 5110
At 31 December 2015 (138) – (202) (139) (85) (564)
Net book value
At 31 December 2015 233 193 296 326 178 1,226
At 31 December 2014 74 – 264 176 129 643
At 1 January 2014 80 – 206 146 86 518
STRATEGIC REPORT GOVERNANCE GROUP FINANCIAL STATEMENTS ADDITIONAL INFORMATIONPARENT COMPANY FINANCIAL STATEMENTS
115IHG Annual Report and Form 20-F 2015