Holiday Inn 2015 Annual Report Download - page 102
Download and view the complete annual report
Please find page 102 of the 2015 Holiday Inn annual report below. You can navigate through the pages in the report by either clicking on the pages listed below, or by using the keyword search tool below to find specific information within the annual report.-
 1
1 -
2
-
3
-
4
-
5
-
6
-
7
-
8
-
9
-
10
-
11
-
12
-
13
-
14
-
15
-
16
-
17
-
18
-
19
-
20
-
21
-
22
-
23
-
24
-
25
-
26
-
27
-
28
-
29
-
30
-
31
-
32
-
33
-
34
-
35
-
36
-
37
-
38
-
39
-
40
-
41
-
42
-
43
-
44
-
45
-
46
-
47
-
48
-
49
-
50
-
51
-
52
-
53
-
54
-
55
-
56
-
57
-
58
-
59
-
60
-
61
-
62
-
63
-
64
-
65
-
66
-
67
-
68
-
69
-
70
-
71
-
72
-
73
-
74
-
75
-
76
-
77
-
78
-
79
-
80
-
81
-
82
-
83
-
84
-
85
-
86
-
87
-
88
-
89
-
90
-
91
-
 92
92 -
 93
93 -
 94
94 -
 95
95 -
 96
96 -
 97
97 -
 98
98 -
 99
99 -
 100
100 -
 101
101 -
 102
102 -
 103
103 -
 104
104 -
 105
105 -
 106
106 -
 107
107 -
 108
108 -
 109
109 -
 110
110 -
 111
111 -
 112
112 -
113
-
114
-
115
-
116
-
117
-
118
-
119
-
120
-
121
-
122
-
123
-
124
-
125
-
126
-
127
-
128
-
129
-
130
-
131
-
132
-
133
-
134
-
135
-
136
-
137
-
138
-
139
-
140
-
141
-
142
-
143
-
144
-
145
-
146
-
147
-
148
-
149
-
150
-
151
-
152
-
153
-
154
-
155
-
156
-
157
-
158
-
159
-
160
-
161
-
162
-
163
-
164
-
165
-
166
-
167
-
168
-
169
-
170
-
171
-
172
-
173
-
174
-
175
-
176
-
177
-
178
-
179
-
180
-
181
-
182
-
183
-
184
 |
 |

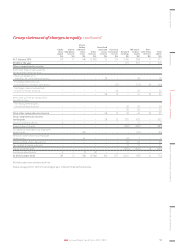
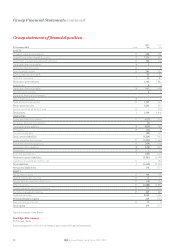
Notes to the Group Financial Statements
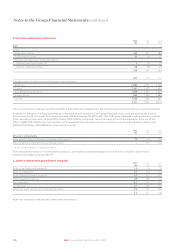
1. Exchange rates
The results of operations have been translated into US dollars at the average rates of exchange for the year. In the case of sterling, the translation
rate is $1=£0.65 (2014: $1=£0.61, 2013: $1=£0.64). In the case of the euro, the translation rate is $1=€0.90 (2014: $1=€0.75, 2013: $1=€0.75).
Assets and liabilities have been translated into US dollars at the rates of exchange on the last day of the year. In the case of sterling, the translation
rate is $1=£0.68 (2014: $1=£0.64, 2013: $1=£0.60). In the case of the euro, the translation rate is $1=€0.92 (2014: $1=€0.82, 2013: $1=€0.73).
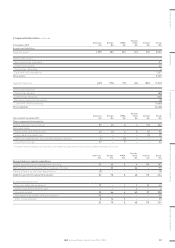
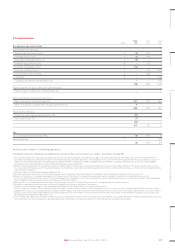
2. Segmental information
The management of the Group’s operations, excluding Central functions, is organised within four geographical regions:
• Americas;
• Europe;
• Asia, Middle East and Africa (AMEA); and
• Greater China
These, together with Central functions, comprise the Group’s five reportable segments. No operating segments have been aggregated to form
these reportable segments.
Central functions include costs of global functions including technology, sales and marketing, finance, human resources and corporate services;
central revenue arises principally from technology fee income. Central liabilities include the loyalty programme liability and the cumulative
short-term System Fund surplus.
Each of the geographical regions is led by its own Chief Executive Officer and derives its revenues from either franchising, managing or owning
hotels and additional segmental disclosures are provided accordingly.
Management monitors the operating results of the geographical regions and Central functions separately for the purpose of making decisions
about resource allocation and performance assessment. Segmental performance is evaluated based on operating profit or loss and is measured
consistently with operating profit or loss in the Consolidated Financial Statements, excluding exceptional items. Group financing activities and
income taxes are managed on a group basis and are not allocated to reportable segments.
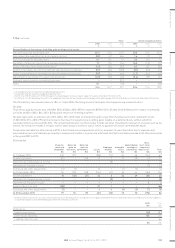
Year ended 31 December 2015
Americas
$m
Europe
$m
AMEA
$m
Greater
China
$m
Central
$m
Group
$m
Revenue
Franchised 661 104 16 4 – 785
Managed 166 131 189 105 – 591
Owned and leased 128 30 36 98 – 292
Central ––––135135
955 265 241 207 135 1,803
Americas
$m
Europe
$m
AMEA
$m
Greater
China
$m
Central
$m
Group
$m
Segmental result
Franchised 575 77 12 5 – 669
Managed 64 28 90 59 – 241
Owned and leased 24 1 3 29 – 57
Regional and central (66) (28) (19) (23) (151) (287)
Reportable segments’ operating profit 597 78 86 70 (151) 680
Exceptional operating items (note 5) (41) 175 (2) 698 (11) 819
Operating profit 556 253 84 768 (162) 1,499
Group
$m
Reportable segments’ operating profit 680
Exceptional operating items (note 5) 819
Operating profit 1,499
Net finance costs (87)
Profit before tax 1,412
Tax (188)
Profit for the year 1,224
All items above relate to continuing operations.
100 IHG Annual Report and Form 20-F 2015