Holiday Inn 2015 Annual Report Download - page 47
Download and view the complete annual report
Please find page 47 of the 2015 Holiday Inn annual report below. You can navigate through the pages in the report by either clicking on the pages listed below, or by using the keyword search tool below to find specific information within the annual report.-
 1
1 -
2
-
3
-
4
-
5
-
6
-
7
-
8
-
9
-
10
-
11
-
12
-
13
-
14
-
15
-
16
-
17
-
18
-
19
-
20
-
21
-
22
-
23
-
24
-
25
-
26
-
27
-
28
-
29
-
30
-
31
-
32
-
33
-
34
-
35
-
36
-
 37
37 -
 38
38 -
 39
39 -
 40
40 -
 41
41 -
 42
42 -
 43
43 -
 44
44 -
 45
45 -
 46
46 -
 47
47 -
 48
48 -
 49
49 -
 50
50 -
 51
51 -
 52
52 -
 53
53 -
 54
54 -
 55
55 -
 56
56 -
 57
57 -
58
-
59
-
60
-
61
-
62
-
63
-
64
-
65
-
66
-
67
-
68
-
69
-
70
-
71
-
72
-
73
-
74
-
75
-
76
-
77
-
78
-
79
-
80
-
81
-
82
-
83
-
84
-
85
-
86
-
87
-
88
-
89
-
90
-
91
-
92
-
93
-
94
-
95
-
96
-
97
-
98
-
99
-
100
-
101
-
102
-
103
-
104
-
105
-
106
-
107
-
108
-
109
-
110
-
111
-
112
-
113
-
114
-
115
-
116
-
117
-
118
-
119
-
120
-
121
-
122
-
123
-
124
-
125
-
126
-
127
-
128
-
129
-
130
-
131
-
132
-
133
-
134
-
135
-
136
-
137
-
138
-
139
-
140
-
141
-
142
-
143
-
144
-
145
-
146
-
147
-
148
-
149
-
150
-
151
-
152
-
153
-
154
-
155
-
156
-
157
-
158
-
159
-
160
-
161
-
162
-
163
-
164
-
165
-
166
-
167
-
168
-
169
-
170
-
171
-
172
-
173
-
174
-
175
-
176
-
177
-
178
-
179
-
180
-
181
-
182
-
183
-
184
 |
 |

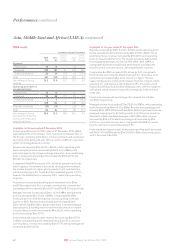
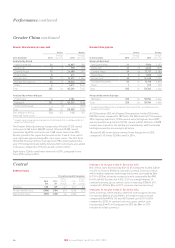
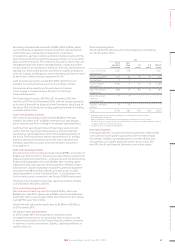
Greater China results
12 months ended 31 December
2015
$m
2014
$m
2015 vs
2014 %
change
2013
$m
2014 vs
2013 %
change
Revenue
Franchised 44–333.3
Managed 105 99 6.1 92 7.6
Owned and leased 98 139 (29.5) 141 (1.4)
Total 207 242 (14.5) 236 2.5
Percentage of Group
revenue
11.5 13.0 (1.5) 12.4 0.6
Operating profit before
exceptional items
Franchised 55–5–
Managed 59 63 (6.3) 51 23.5
Owned and leased 29 42 (31.0) 47 (10.6)
93 110 (15.5) 103 6.8
Regional overheads (23) (21) (9.5) (21) –
Total 70 89 (21.3) 82 8.5
Percentage of Group
operating profit before
central overheads and
exceptional items
8.4 11.0 (2.6) 10.0 1.0
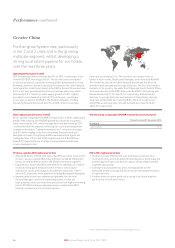
Highlights for the year ended 31December 2015
Comprising 265 hotels (85,509 rooms) at 31 December 2015, Greater
China represented approximately 12% of the Group’s room count and
contributed approximately 9% of the Group’s operating profit before
central overheads and exceptional operating items for the year ended
31 December 2015. 97% of rooms in Greater China are operated under
the managed business model.
Revenue and operating profit before exceptional items decreased
by $35m (14.5%) to $207m and by $19m (21.3%) to $70m respectively.
On an underlyinga basis, revenue increased by $8m (7.8%) due to the
addition of over 20,000 rooms into the managed estate over the
last two years. Underlying operating profit decreased by $5m (10.6%),
impacted by $5m of ongoing investment into building long-term people
capability, as well as the year-on-year impact from $5m of previously
disclosed one-off upsides in 2014. Overall, the region achieved
comparable RevPAR growth of 0.3%, significantly ahead of the industry,
reflecting our scale and management strength in the region. Trading
in mainland tier 1 cities was particularly strong, whilst the rest of
mainland China showed marginal increases. Trading in Hong Kong and
Macau significantly declined. Total RevPAR in Greater China decreased
by 2.3% as more hotels opened into developing markets.
Franchised revenue and operating profit remained flat at $4m and
$5m respectively.
Managed revenue increased by $6m (6.1%) to $105m, whilst operating
profit decreased by $4m (6.3%) to $59m, impacted by the above-
mentioned investment in people capability and previously disclosed
one-off upsides in 2014. Comparable RevPAR increased by 1.1%,
whilst the Greater China System size grew by 10.4%, driving a 4.8%
increase in total gross revenue derived from rooms business. Total
gross revenue derived from non-rooms business increased by 7.9%,
due primarily to increased food and beverage revenue. On a constant
currency basis, revenue increased by $8m (8.1%) to $107m, whilst
operating profit decreased by $3m (4.8%) to $60m.
The one remaining hotel in the owned and leased estate,
InterContinental Hong Kong, was sold on 30 September 2015 for
proceeds of $928m after final working capital adjustments and cash
tax. Owned and leased revenue decreased by $41m (29.5%) to $98m
and operating profit decreased by $13m (31.0%) to $29m.
Highlights for the year ended 31December 2014
Revenue and operating profit before exceptional items increased
by $6m (2.5%) to $242m and by $7m (8.5%) to $89m respectively.
Overall, the region achieved comparable RevPAR growth of 1.6%,
slightly stronger than the 1.0% growth achieved in 2013. This
performance was significantly ahead of the industry, reflecting IHG’s
scale and management strength in the region, and was achieved in
a challenging environment with slower macroeconomic conditions,
government austerity measures and protests in Hong Kong. Trading
was strongest in tier 1 cities, especially Shanghai and Guangzhou, with
good levels of transient and corporate business. Performance in tier 2
and 3 cities continues to be impacted by new supply as these markets
develop. Total RevPAR in the region decreased by 3.4% as hotels
opened in these lower RevPAR markets.
Franchised revenue increased by $1m (33.3%) to $4m whilst operating
profit was flat at $5m. Operating profit was higher than revenue in
both 2014 and 2013 due to joint-venture dividend income received from
a hotel in Hong Kong.
Managed revenue increased by $7m (7.6%) to $99m, whilst operating
profit increased by $12m (23.5%) to $63m, reflecting improvements
in operating margin, net rooms growth, and a small number of one-off
items that contributed approximately $5m to the result. Comparable
RevPAR increased by 1.3%, whilst the Greater China System size grew
by 14.7%, driving a 8.5% increase in total gross revenue derived from
rooms business. Total gross revenue derived from non-rooms
business increased by 7.8%.
Owned and leased revenue decreased by $2m (1.4%) to $139m, driven
by a RevPAR decrease of 1.0% at InterContinental Hong Kong. Operating
profit decreased by $5m (10.6%) to $42m. The decrease in revenue
and operating profit at the hotel was driven primarily by the ongoing
development of the area adjacent to the hotel and protests in central
Hong Kong.
a Underlying excludes the impact of owned-asset disposals, significant liquidated damages,
Kimpton, and the results from managed-lease hotels, translated at constant currency by
applying prior-year exchange rates.
45
IHG Annual Report and Form 20-F 2015
STRATEGIC REPORT GOVERNANCE GROUP FINANCIAL STATEMENTS ADDITIONAL INFORMATIONPARENT COMPANY FINANCIAL STATEMENTS