Holiday Inn 2015 Annual Report Download - page 38
Download and view the complete annual report
Please find page 38 of the 2015 Holiday Inn annual report below. You can navigate through the pages in the report by either clicking on the pages listed below, or by using the keyword search tool below to find specific information within the annual report.-
 1
1 -
2
-
3
-
4
-
5
-
6
-
7
-
8
-
9
-
10
-
11
-
12
-
13
-
14
-
15
-
16
-
17
-
18
-
19
-
20
-
21
-
22
-
23
-
24
-
25
-
26
-
27
-
 28
28 -
 29
29 -
 30
30 -
 31
31 -
 32
32 -
 33
33 -
 34
34 -
 35
35 -
 36
36 -
 37
37 -
 38
38 -
 39
39 -
 40
40 -
 41
41 -
 42
42 -
 43
43 -
 44
44 -
 45
45 -
 46
46 -
 47
47 -
 48
48 -
49
-
50
-
51
-
52
-
53
-
54
-
55
-
56
-
57
-
58
-
59
-
60
-
61
-
62
-
63
-
64
-
65
-
66
-
67
-
68
-
69
-
70
-
71
-
72
-
73
-
74
-
75
-
76
-
77
-
78
-
79
-
80
-
81
-
82
-
83
-
84
-
85
-
86
-
87
-
88
-
89
-
90
-
91
-
92
-
93
-
94
-
95
-
96
-
97
-
98
-
99
-
100
-
101
-
102
-
103
-
104
-
105
-
106
-
107
-
108
-
109
-
110
-
111
-
112
-
113
-
114
-
115
-
116
-
117
-
118
-
119
-
120
-
121
-
122
-
123
-
124
-
125
-
126
-
127
-
128
-
129
-
130
-
131
-
132
-
133
-
134
-
135
-
136
-
137
-
138
-
139
-
140
-
141
-
142
-
143
-
144
-
145
-
146
-
147
-
148
-
149
-
150
-
151
-
152
-
153
-
154
-
155
-
156
-
157
-
158
-
159
-
160
-
161
-
162
-
163
-
164
-
165
-
166
-
167
-
168
-
169
-
170
-
171
-
172
-
173
-
174
-
175
-
176
-
177
-
178
-
179
-
180
-
181
-
182
-
183
-
184
 |
 |

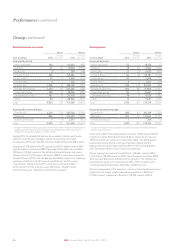
Performance continued
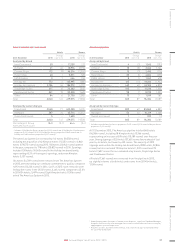
Americas results
12 months ended 31 December
2015
$m
2014
$m
2015 vs
2014 %
change
2013
$m
2014 vs
2013 %
change
Revenue
Franchised 661 630 4.9 576 9.4
Managed 166 103 61.2 128 (19.5)
Owned and leased 128 138 (7.2) 212 (34.9)
Total 955 871 9.6 916 (4.9)
Percentage of
Group revenue
53.0 46.9 6.1 48.1 (1.2)
Operating profit before
exceptional items
Franchised 575 544 5.7 499 9.0
Managed 64 47 36.2 74 (36.5)
Owned and leased 24 18 33.3 30 (40.0)
663 609 8.9 603 1.0
Regional overheads (66) (65) (1.5) (53) (22.6)
Total 597 544 9.7 550 (1.1)
Percentage of Group
operating profit before
central overheads and
exceptional items
71.9 67.5 4.4 66.8 0.7
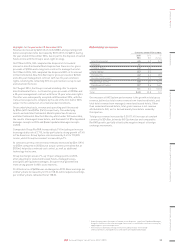
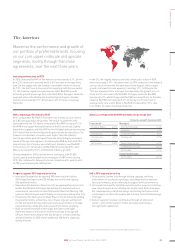
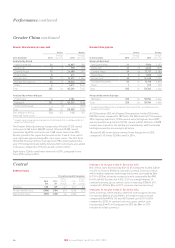
Highlights for the year ended 31 December 2015
With 3,840 hotels (479,575 rooms), The Americas represented 64% of
the Group’s room count and 72% of the Group’s operating profit before
central overheads and exceptional operating items for the year ended
31 December 2015. The key profit-producing region is the US, although
the Group is also represented in Latin America, Canada, Mexico and
the Caribbean. 88% of rooms in the region are operated under the
franchise business model, primarily in the upper midscale segment
(the Holiday Inn brand family). In the upscale segment, Crowne Plaza
is predominantly franchised whereas, in the luxury segment,
InterContinental-branded hotels are operated under both franchise
and management agreements. Kimpton operates under the managed
model within the upper upscale segment. 11 of the Group’s 12 hotel
brands are represented in The Americas.
Revenue and operating profit before exceptional items increased
by $84m (9.6%) to $955m and by $53m (9.7%) to $597m respectively.
On an underlyinga basis, revenue increased by $71m (8.8%), while
operating profit increased by $53m (9.9%), driven predominantly by
strong RevPAR growth in the fee business and an increase in net
rooms. The underlying results exclude both InterContinental Mark
Hopkins San Francisco and InterContinental New York Barclay whilst
under IHG ownership, managed leases, Kimpton, and the benefit of
significant liquidated damages receipts (2015: $3m; 2014: $7m).
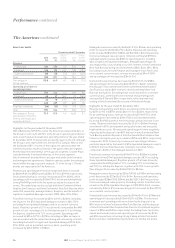
Franchised revenue increased by $31m (4.9%) to $661m, including
the impact of the $7m liquidated damages receipts in 2014 (7.9%
excluding these liquidated damages and on a constant currency
basis). Royaltiesb growth of 5.1% was driven by comparable RevPAR
growth of 4.6%, including 4.6% for Holiday Inn and 4.1% for Holiday
Inn Express, together with 1.2% rooms growth. Operating profit
increased by $31m (5.7%) to $575m, including an $8m increase in
fees associated with the initial franchising and relicensing of hotels.
Excluding the benefit of significant liquidated damages (2015: $nil;
2014: $7m), and on a constant currency basis, operating profit
increased by $47m (8.8%) to $584m.
Managed revenue increased by $63m (61.2%) to $166m, and operating
profit increased by $17m (36.2%) to $64m. Revenue and operating
profit included $38m (2014: $38m) and $nil (2014: $nil) respectively
from one managed-lease property. Kimpton contributed $59m to
managed estate revenue and $18m to operating profit, including
$3m of significant liquidated damages. Managed operating profit
was impacted by costs relating to our 20% interest in InterContinental
New York Barclay during its refurbishment (2015: $4m; 2014: $5m).
Excluding results for both Kimpton and managed-lease hotels and
on a constant currency basis, revenue increased by $9m (13.8%)
and operating profit increased by $2m (4.3%).
Owned and leased revenue decreased by $10m (7.2%) to $128m,
and operating profit increased by $6m (33.3%) to $24m, following
the disposal of two owned hotels (InterContinental Mark Hopkins
San Francisco and an 80% interest in InterContinental New York
Barclay) during 2014. Excluding these two hotels and on a constant
currency basis, owned and leased revenue and operating profit
increased by $13m and $5m, respectively, reflecting improved
trading at InterContinental Boston and at Holiday Inn Aruba.
Highlights for the year ended 31 December 2014
Revenue and operating profit before exceptional items decreased
by $45m (4.9%) to $871m and by $6m (1.1%) to $544m respectively.
On an underlyinga basis, revenue increased by $71m (9.7%), while
operating profit increased by $39m (7.8%), driven predominantly
by strong RevPAR growth in the fee business and an increase in net
rooms. Regional overheads increased by 22.6% to $65m following
investment in IHG’s development and quality teams and unusually
high healthcare costs. Revenue and operating profit were negatively
impacted by the disposal of an 80% interest in InterContinental New
York Barclay and the disposal of InterContinental Mark Hopkins San
Francisco during the year, by a combined $95m and $21m respectively
compared to 2013. Conversely, revenue and operating profit were
positively impacted by the benefit of $7m liquidated damages receipts
in 2014 in the franchised business relating to two exited hotels,
compared to $31m in the managed business in 2013.
Franchised revenue increased by $54m (9.4%) to $630m including
the benefit of the $7m liquidated damages receipts (8.2% excluding
these liquidated damages). Royalties growth of 7.6% was driven by
comparable RevPAR growth of 7.2%, including 7.9% for Holiday Inn
and 7.0% for Holiday Inn Express, together with 2.0% rooms growth.
Operating profit increased by $45m (9.0%) to $544m.
Managed revenue decreased by $25m (19.5%) to $103m and operating
profit decreased by $27m (36.5%) to $47m. Revenue and operating
profit included $38m (2013: $34m) and $nil (2013: $nil) respectively
from one managed-lease property. Excluding results from this hotel,
as well as the $31m liquidated damages in 2013 (2014: $nil), revenue
increased by $3m (4.8%) and operating profit increased by $4m (9.3%)
on a constant currency basis.
Owned and leased revenue decreased by $74m (34.9%) to $138m and
operating profit decreased by $12m (40.0%) to $18m. The decrease
in revenue and operating profit were driven by the disposal of an
80% interest in InterContinental New York Barclay, and the disposal
of InterContinental Mark Hopkins San Francisco (combined negative
impact of $95m and $21m respectively). Excluding these two hotels,
owned and leased revenue and operating profit increased by $21m
and $9m respectively reflecting strong trading at InterContinental
Boston and post refurbishment performance at Holiday Inn Aruba.
The Americas continued
36 IHG Annual Report and Form 20-F 2015