Holiday Inn 2015 Annual Report Download - page 36
Download and view the complete annual report
Please find page 36 of the 2015 Holiday Inn annual report below. You can navigate through the pages in the report by either clicking on the pages listed below, or by using the keyword search tool below to find specific information within the annual report.-
 1
1 -
2
-
3
-
4
-
5
-
6
-
7
-
8
-
9
-
10
-
11
-
12
-
13
-
14
-
15
-
16
-
17
-
18
-
19
-
20
-
21
-
22
-
23
-
24
-
25
-
 26
26 -
 27
27 -
 28
28 -
 29
29 -
 30
30 -
 31
31 -
 32
32 -
 33
33 -
 34
34 -
 35
35 -
 36
36 -
 37
37 -
 38
38 -
 39
39 -
 40
40 -
 41
41 -
 42
42 -
 43
43 -
 44
44 -
 45
45 -
 46
46 -
47
-
48
-
49
-
50
-
51
-
52
-
53
-
54
-
55
-
56
-
57
-
58
-
59
-
60
-
61
-
62
-
63
-
64
-
65
-
66
-
67
-
68
-
69
-
70
-
71
-
72
-
73
-
74
-
75
-
76
-
77
-
78
-
79
-
80
-
81
-
82
-
83
-
84
-
85
-
86
-
87
-
88
-
89
-
90
-
91
-
92
-
93
-
94
-
95
-
96
-
97
-
98
-
99
-
100
-
101
-
102
-
103
-
104
-
105
-
106
-
107
-
108
-
109
-
110
-
111
-
112
-
113
-
114
-
115
-
116
-
117
-
118
-
119
-
120
-
121
-
122
-
123
-
124
-
125
-
126
-
127
-
128
-
129
-
130
-
131
-
132
-
133
-
134
-
135
-
136
-
137
-
138
-
139
-
140
-
141
-
142
-
143
-
144
-
145
-
146
-
147
-
148
-
149
-
150
-
151
-
152
-
153
-
154
-
155
-
156
-
157
-
158
-
159
-
160
-
161
-
162
-
163
-
164
-
165
-
166
-
167
-
168
-
169
-
170
-
171
-
172
-
173
-
174
-
175
-
176
-
177
-
178
-
179
-
180
-
181
-
182
-
183
-
184
 |
 |

Performance continued
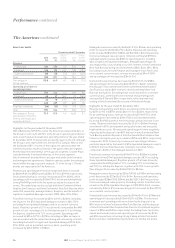
Global hotel and room count
Hotels Rooms
At 31 December 2015
Change
over 2014 2015
Change
over 2014
Analysed by brand
InterContinental 184 4 62,040 805
Kimpton 61 61 10,976 10,976
HUALUXE 3 3 798 798
Crowne Plaza 406 – 113,284 (278)
Hotel Indigo 65 4 7,664 933
EVEN Hotels 3 1 446 150
Holiday Inna1,226 14 228,100 2,941
Holiday Inn Express 2,425 60 236,406 7,296
Staybridge Suites 220 15 23,964 1,555
Candlewood Suites 341 19 32,328 1,620
Other 98 11 28,362 7,277
Total 5,032 192 744,368 34,073
Analysed by ownership type
Franchised 4,219 123 530,748 15,764
Managed 806 71 211,403 19,282
Owned and leased 7 (2) 2,217 (973)
Total 5,032 192 744,368 34,073
a Includes 47 Holiday Inn Resort properties (11,518 rooms) and 16 Holiday Inn Club Vacations
properties (5,231 rooms) (2014: 42 Holiday Inn Resort properties (9,904 rooms) and 12
Holiday Inn Club Vacations properties (4,027 rooms)).
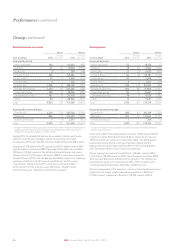
During 2015, the global IHG System (the number of hotels and rooms
which are franchised, managed, owned or leased by the Group)
increased by 192 hotels (34,073 rooms) to 5,032 hotels (744,368 rooms).
Openings of 273 hotels (44,427 rooms) were 8.2% higher than in 2014
and the highest level since 2009. Openings in The Americas included
130 hotels (14,963 rooms) in the Holiday Inn brand family and seven
Kimpton hotels (1,157 rooms). 32 hotels (9,380 rooms) were opened in
Greater China in 2015, with the Europe and AMEA regions contributing
openings of 36 hotels (5,493 rooms) and 22 hotels (6,612 rooms)
respectively. 143 hotels (21,679 rooms) were removed in 2015,
an increase from the previous year (123 hotels, 17,630 rooms),
demonstrating our continued commitment to quality.
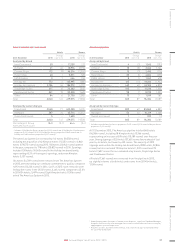
Global pipeline
Hotels Rooms
At 31 December 2015
Change
over 2014 2015
Change
over 2014
Analysed by brand
InterContinental 52 2 15,676 12
Kimpton 18 18 3,366 3,366
HUALUXE 21 (3) 6,632 (919)
Crowne Plaza 84 (8) 23,181 (2,155)
Hotel Indigo 63 – 9,208 112
EVEN Hotels 8 5 1,262 678
Holiday Innb 256 (13) 52,204 (509)
Holiday Inn Express 602 80 75,605 12,651
Staybridge Suites 114 15 12,641 1,733
Candlewood Suites 98 9 8,720 1,003
Other 14 45,421 4,172
Total 1,330 109 213,916 20,144
Analysed by ownership type
Franchised 905 62 102,169 7,4 39
Managed 424 47 111,545 12,707
Owned and leased 1– 202 (2)
Total 1,330 109 213,916 20,144
b Includes 14 Holiday Inn Resortproperties (3,548 rooms) (2014: 18 Holiday Inn Resort
properties (4,412rooms)).
At the end of 2015, the global pipeline totalled 1,330 hotels (213,916
rooms) including 18 Kimpton hotels (3,366 rooms), an increase of
109 hotels (20,144 rooms) on 31 December 2014. The IHG pipeline
represents hotels where a contract has been signed and the
appropriate fees paid. Approximately 90% of the closing pipeline
at 31 December 2015 is in our 10 priority markets.
Group signings increased from 463 hotels (69,696 rooms) in 2014
to 474 hotels (78,438 rooms) in 2015, the strongest level since 2008.
This included 306 hotels (47,676 rooms) signed for the Holiday Inn
brand family, up by 4.7% compared to 2014, 27.0% of which were
contributed by Greater China (48 hotels, 12,878 rooms).
Active management of the pipeline to remove deals that have become
dormant or no longer viable reduced the pipeline by 108 hotels
(17,004 rooms), compared to 96 hotels (15,333 rooms) in 2014.
Group continued
34 IHG Annual Report and Form 20-F 2015