Holiday Inn 2015 Annual Report Download - page 35
Download and view the complete annual report
Please find page 35 of the 2015 Holiday Inn annual report below. You can navigate through the pages in the report by either clicking on the pages listed below, or by using the keyword search tool below to find specific information within the annual report.-
 1
1 -
2
-
3
-
4
-
5
-
6
-
7
-
8
-
9
-
10
-
11
-
12
-
13
-
14
-
15
-
16
-
17
-
18
-
19
-
20
-
21
-
22
-
23
-
24
-
 25
25 -
 26
26 -
 27
27 -
 28
28 -
 29
29 -
 30
30 -
 31
31 -
 32
32 -
 33
33 -
 34
34 -
 35
35 -
 36
36 -
 37
37 -
 38
38 -
 39
39 -
 40
40 -
 41
41 -
 42
42 -
 43
43 -
 44
44 -
 45
45 -
46
-
47
-
48
-
49
-
50
-
51
-
52
-
53
-
54
-
55
-
56
-
57
-
58
-
59
-
60
-
61
-
62
-
63
-
64
-
65
-
66
-
67
-
68
-
69
-
70
-
71
-
72
-
73
-
74
-
75
-
76
-
77
-
78
-
79
-
80
-
81
-
82
-
83
-
84
-
85
-
86
-
87
-
88
-
89
-
90
-
91
-
92
-
93
-
94
-
95
-
96
-
97
-
98
-
99
-
100
-
101
-
102
-
103
-
104
-
105
-
106
-
107
-
108
-
109
-
110
-
111
-
112
-
113
-
114
-
115
-
116
-
117
-
118
-
119
-
120
-
121
-
122
-
123
-
124
-
125
-
126
-
127
-
128
-
129
-
130
-
131
-
132
-
133
-
134
-
135
-
136
-
137
-
138
-
139
-
140
-
141
-
142
-
143
-
144
-
145
-
146
-
147
-
148
-
149
-
150
-
151
-
152
-
153
-
154
-
155
-
156
-
157
-
158
-
159
-
160
-
161
-
162
-
163
-
164
-
165
-
166
-
167
-
168
-
169
-
170
-
171
-
172
-
173
-
174
-
175
-
176
-
177
-
178
-
179
-
180
-
181
-
182
-
183
-
184
 |
 |

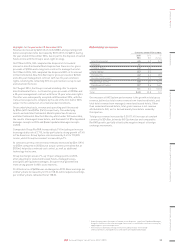
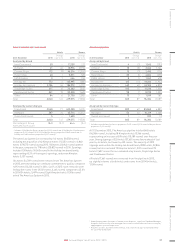
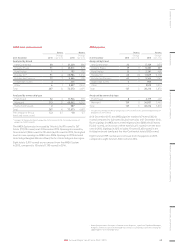
Global total gross revenue
12 months ended 31 December
2015
$bn
2014
$bn
%
change
InterContinental 4.5 4.7 (4.3)
Kimpton 1.1 ––
Crowne Plaza 4.2 4.2 –
Hotel Indigo 0.3 0.3 –
Holiday Inn 6.2 6.4 (3.1)
Holiday Inn Express 6.1 5.7 7.0
Staybridge Suites 0.8 0.7 14.3
Candlewood Suites 0.7 0.6 16.7
Other 0.1 0.2 (50.0)
Total 24.0 22.8 5.3
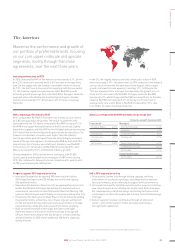
One measure of IHG System performance is the growth in total gross
revenue, defined as total rooms revenue from franchised hotels, and
total hotel revenue from managed, owned and leased hotels. Other
than owned and leased hotels, total gross revenue is not revenue
attributable to IHG, as it is derived mainly from hotels owned by
third parties.
Total gross revenue increased by 5.3% (11.4% increase at constant
currency) to $24.0bn, driven by IHG System size and comparable
RevPAR growth, partially offset by the negative impact of foreign
exchange movements.
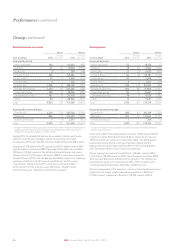
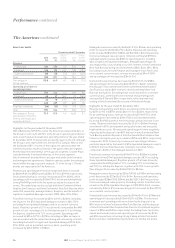
Highlights for the year ended 31 December 2014
Revenue decreased by $45m (2.4%) to $1,858m and operating profit
before exceptional items decreased by $17m (2.5%) to $651m during
the year ended 31 December 2014, due in part to the disposal of owned
hotels in line with the Group’s asset-light strategy.
On 27 March 2014, IHG completed the disposal of its freehold
interest in InterContinental Mark Hopkins San Francisco for gross
proceeds of $120m and a long-term contract to manage the hotel.
On 31 March 2014, IHG completed the disposal of 80% of its interest
in InterContinental New York Barclay for gross proceeds of $274m
and a 30-year management contract with two 10-year extension
rights, retaining the remaining 20% in a joint venture set up to own
and refurbish the hotel.
On 7 August 2014, the Group received a binding offer to acquire
InterContinental Paris – Le Grand for gross proceeds of €330m and
a 30-year management contract with three 10-year extension rights.
The offer was subsequently accepted on 8 December 2014, with the
transaction expected to complete by the end of the first half of 2015,
subject to the satisfaction of certain standard conditions.
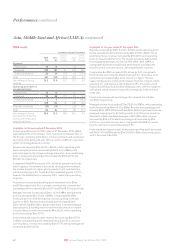
On an underlyinga basis, revenue and operating profit increased
by $94m (6.0%) and $57m (9.6%) respectively. The underlying
results exclude InterContinental Mark Hopkins San Francisco
and InterContinental New York Barclay whilst under IHG ownership,
the results of managed-lease hotels, and the benefit of $7m liquidated
damages receipts in 2014 and $46m liquidated damages receipts
in 2013.
Comparable Group RevPAR increased by 6.1% (including an increase
in average daily rate of 2.7%), led by particularly strong growth of 7.4%
in The Americas. Group System size increased by 3.4% to 710,295
rooms, whilst Group fee revenueb increased by 6.7%.
At constant currency, net central overheads decreased by $3m (1.9%)
to $152m compared to 2013 (but at actual currency remained flat at
$155m), helped by continued cost control, as well as additional
technology fee income.
Group fee margin was 44.7%, up 1.5 percentage points on 2013,
after adjusting for owned and leased hotels, managed leases,
and significant liquidated damages. Group fee margin benefited
from strong growth in IHG’s scale markets.
Profit before tax of $600m was unchanged on 2013. Basic earnings per
ordinary share increased by 12.3% to 158.3¢, whilst adjusted earnings
per ordinary share remained flat at 158.3¢.
a Underlying excludes the impact of owned-asset disposals, significant liquidated damages,
Kimpton, and the results from managed-lease hotels, translated at constant currency by
applying prior-year exchange rates.
b Fee revenue is defined as Group revenue excluding revenue from owned
and leased hotels, managed leases and significant liquidated damages.
33
IHG Annual Report and Form 20-F 2015
STRATEGIC REPORT GOVERNANCE GROUP FINANCIAL STATEMENTS ADDITIONAL INFORMATIONPARENT COMPANY FINANCIAL STATEMENTS