Holiday Inn 2015 Annual Report Download - page 157
Download and view the complete annual report
Please find page 157 of the 2015 Holiday Inn annual report below. You can navigate through the pages in the report by either clicking on the pages listed below, or by using the keyword search tool below to find specific information within the annual report.-
 1
1 -
2
-
3
-
4
-
5
-
6
-
7
-
8
-
9
-
10
-
11
-
12
-
13
-
14
-
15
-
16
-
17
-
18
-
19
-
20
-
21
-
22
-
23
-
24
-
25
-
26
-
27
-
28
-
29
-
30
-
31
-
32
-
33
-
34
-
35
-
36
-
37
-
38
-
39
-
40
-
41
-
42
-
43
-
44
-
45
-
46
-
47
-
48
-
49
-
50
-
51
-
52
-
53
-
54
-
55
-
56
-
57
-
58
-
59
-
60
-
61
-
62
-
63
-
64
-
65
-
66
-
67
-
68
-
69
-
70
-
71
-
72
-
73
-
74
-
75
-
76
-
77
-
78
-
79
-
80
-
81
-
82
-
83
-
84
-
85
-
86
-
87
-
88
-
89
-
90
-
91
-
92
-
93
-
94
-
95
-
96
-
97
-
98
-
99
-
100
-
101
-
102
-
103
-
104
-
105
-
106
-
107
-
108
-
109
-
110
-
111
-
112
-
113
-
114
-
115
-
116
-
117
-
118
-
119
-
120
-
121
-
122
-
123
-
124
-
125
-
126
-
127
-
128
-
129
-
130
-
131
-
132
-
133
-
134
-
135
-
136
-
137
-
138
-
139
-
140
-
141
-
142
-
143
-
144
-
145
-
146
-
 147
147 -
 148
148 -
 149
149 -
 150
150 -
 151
151 -
 152
152 -
 153
153 -
 154
154 -
 155
155 -
 156
156 -
 157
157 -
 158
158 -
 159
159 -
 160
160 -
 161
161 -
 162
162 -
 163
163 -
 164
164 -
 165
165 -
 166
166 -
 167
167 -
168
-
169
-
170
-
171
-
172
-
173
-
174
-
175
-
176
-
177
-
178
-
179
-
180
-
181
-
182
-
183
-
184
 |
 |

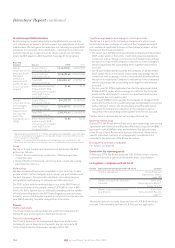
Going concern
An overview of the business activities of IHG, including a review of the
key business risks that the Group faces, is given in the Strategic Report
on pages 2 to 49 and in the Group information on pages 156 to 164.
Information on the Group’s treasury management policies can be found
in note 20 to the Group Financial Statements on pages 122 to 125.
The Group refinanced its bank debt in March 2015 and put in place
a new five-year $1.275bn facility with an optional two-year extension
and in August 2015 the Group issued a 10-year £300m sterling bond.
At the end of 2015, the Group was trading significantly within its
banking covenants and debt facilities.
The Group’s fee-based model and wide geographic spread mean that
it is well placed to manage through uncertain times, and our forecasts
and sensitivity projections, based on a range of reasonably possible
changes in trading performance, show that the Group should be able
to operate within the level of its current facilities.
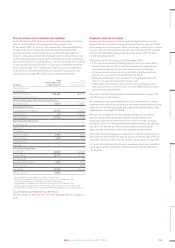
Revenue per available room (RevPAR)
This comprises total IHG System rooms revenue divided by the
number of room nights available (and can be mathematically derived
from occupancy rate multiplied by average daily rate).
Fee revenue
This comprises Group revenue (2015: $1,803m; 2014: $1,858m)
excluding owned and leased hotels (2015: $292m; 2014: $427m),
managed leases (2015: $159m; 2014: $169m) and significant liquidated
damages (2015: $3m; 2014: $7m). Growth is stated at constant
exchange rate.
Non-GAAP calculations
See pages 2 and 3.
The non-GAAP measures listed below have been adjusted from their underlying GAAP measures in the following ways.
After making enquiries, the Directors have a reasonable expectation
that the Company and the Group have adequate resources to continue
in operational existence for the foreseeable future and, accordingly,
they continue to adopt the going concern basis in preparing the
Consolidated Financial Statements.
Please see page 27 for the Directors’ assessment of the viability
of the Group.
By order of the Board
George Turner
Company Secretary
InterContinental Hotels Group PLC
Registered in England and Wales, Company number 5134420
22 February 2016
Total gross revenue
The 2015 figure of $24.0bn and the 2014 figure of $22.8bn comprises
total rooms revenue from franchised hotels (2015: $14.1bn; 2014:
$13.4bn) and total hotel revenue from managed, owned and leased
hotels (2015: $9.9bn; 2014: $9.4bn). Other than owned and leased
hotels, it is not revenue attributable to IHG, as it is derived mainly
from hotels owned by third parties.
Total operating profit before exceptional items and tax
Includes one liquidated damages receipt in 2015: $3m in The Americas
with respect to a Kimpton property (2014: two liquidated damages
receipts: $7m, both in The Americas).
Total underlying operating profit growth
The 2015 figure of $67m excludes the impact of owned asset disposals
(2015: $30m; 2014: $55m), managed leases (2015: $7m; 2014: $6m),
significant liquidated damages (2015: $3m; 2014: $7m), Kimpton (2015:
$15m; 2014: $nil) and exceptional items, all translated at constant
currency using prior-year exchange rates.
The 2014 figure of $57m excludes the impact of owned and leased
disposals (2014: -$1m; 2013: $28m), managed leases (2014: $6m; 2013
$3m), significant liquidated damages (2014: $7m; 2013: $46m) and
exceptional items, all translated at constant currency using prior-year
exchange rates.
STRATEGIC REPORT GOVERNANCE GROUP FINANCIAL STATEMENTS ADDITIONAL INFORMATIONPARENT COMPANY FINANCIAL STATEMENTS
155IHG Annual Report and Form 20-F 2015