Holiday Inn 2015 Annual Report Download - page 72
Download and view the complete annual report
Please find page 72 of the 2015 Holiday Inn annual report below. You can navigate through the pages in the report by either clicking on the pages listed below, or by using the keyword search tool below to find specific information within the annual report.-
 1
1 -
2
-
3
-
4
-
5
-
6
-
7
-
8
-
9
-
10
-
11
-
12
-
13
-
14
-
15
-
16
-
17
-
18
-
19
-
20
-
21
-
22
-
23
-
24
-
25
-
26
-
27
-
28
-
29
-
30
-
31
-
32
-
33
-
34
-
35
-
36
-
37
-
38
-
39
-
40
-
41
-
42
-
43
-
44
-
45
-
46
-
47
-
48
-
49
-
50
-
51
-
52
-
53
-
54
-
55
-
56
-
57
-
58
-
59
-
60
-
61
-
 62
62 -
 63
63 -
 64
64 -
 65
65 -
 66
66 -
 67
67 -
 68
68 -
 69
69 -
 70
70 -
 71
71 -
 72
72 -
 73
73 -
 74
74 -
 75
75 -
 76
76 -
 77
77 -
 78
78 -
 79
79 -
 80
80 -
 81
81 -
 82
82 -
83
-
84
-
85
-
86
-
87
-
88
-
89
-
90
-
91
-
92
-
93
-
94
-
95
-
96
-
97
-
98
-
99
-
100
-
101
-
102
-
103
-
104
-
105
-
106
-
107
-
108
-
109
-
110
-
111
-
112
-
113
-
114
-
115
-
116
-
117
-
118
-
119
-
120
-
121
-
122
-
123
-
124
-
125
-
126
-
127
-
128
-
129
-
130
-
131
-
132
-
133
-
134
-
135
-
136
-
137
-
138
-
139
-
140
-
141
-
142
-
143
-
144
-
145
-
146
-
147
-
148
-
149
-
150
-
151
-
152
-
153
-
154
-
155
-
156
-
157
-
158
-
159
-
160
-
161
-
162
-
163
-
164
-
165
-
166
-
167
-
168
-
169
-
170
-
171
-
172
-
173
-
174
-
175
-
176
-
177
-
178
-
179
-
180
-
181
-
182
-
183
-
184
 |
 |

Audited Audited
Quick read
0
50
100
150
200
Threshold Target Actual Maximum
EBIT Employee
Engagement
Guest
HeartBeat
% of target award
50
100
130.3
200
5
5
10
20
20
40
140
28.4
81.9
70
20
10
35
Threshold Actual Maximum
0
25
50
75
100
TSR
% of maximum opportunity 100
20
50
5
5
50
25
50
25
10
RevPARNet rooms
supply growth
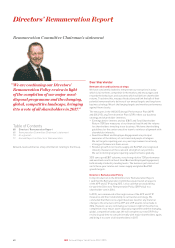
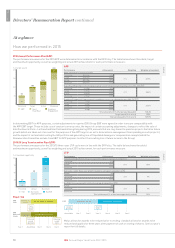
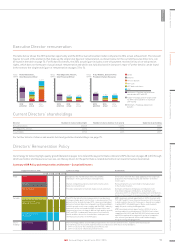
Directors’ Remuneration Report continued
At a glance
How we performed in 2015
2015 Annual Performance Plan (APP)
The performance measures for the 2015 APP were determined in accordance with the DR Policy. The table below shows threshold, target
and maximum opportunity, as well as weighting and actual 2015 achievement for each performance measure:
APP
Performance Achievement Weighting Weighted achievement
EBIT: performance relative to target
Threshold $621.0m 50%
70% 81.9%
Target $690.0m 100%
Actual $701.9m 117%
Maximum $759.0m 200%
Guest HeartBeat: improvement in guest survey score from prior year’s baseline score of 83.60%
Threshold +0.25pt 50%
20% 28.4%
Target +0.50pt 100%
Actual +0.92pt 142%
Maximum +1.50pt 200%
Employee Engagement: improvement in employee survey score from prior year of 84.7%
Threshold -0.7pt 50%
10% 20.0%
Target +0.3pt 100%
Maximum +2.0pt 200%
Actual +2.6pt 200%
Total achievement (% of target award payable) 130.3%
Target award (% of salary) 115%
Total award payable (% of salary) 149.9%
In determining EBIT for APP purposes, certain adjustments to reported 2015 Group EBIT were agreed in order to ensure comparability with
the APP EBIT target. These include: use of constant currency rates, the impact of certain accounting adjustments, changes to reflect the sale of
InterContinental Paris – Le Grand and InterContinental Hong Kong during 2015, amounts that are ring-fenced to spend on projects that drive future
growth (which are taken out of account for the purposes of the APP target so as not to disincentivise management from spending on such projects),
and the impact of certain hotels exiting the IHG portfolio and generating one-off liquidated damages or compensation receipts (which the
Remuneration Committee exclude from EBIT for APP purposes to reflect the resulting loss of future income to the Group).
2013/15 Long Term Incentive Plan (LTIP)
The performance measures for the 2013/15 three-year LTIP cycle were in line with the DR Policy. The table below shows threshold
and maximum opportunity, as well as weighting and actual 2015 achievement, for each performance measure.
LTIP
Performance Achievement Weighting Weighted achievement
Total Shareholder Return: three-year growth relative to average of competitors
Threshold 20%
50% 50%
Actual 100%
Maximum 100%
Net rooms supply: three-year growth relative to average of competitors
Actual 0%
25% 0%
Threshold 20%
Maximum 100%
RevPAR: three-year growth relative to average of competitors
Actual 0%
25% 0%
Threshold 20%
Maximum 100%
Total achievement (% of maximum opportunity vested) 50%
APP
deferred
shares
Period subject to clawback
Performance
period
Performance
period
Cash
award
paid
Period subject to malus
Award dateYear -1 Year 1 Year 2 Year 3
APP
cash
Deferred
award
granted
Deferred
award
vests
Period subject to clawback
Award
granted
LTIP
Award date Year 1 Year 2 Year 3 Year 4 Year 5 Year 6
Performance period
Award
vests
Pay at risk
Malus allows for awards to be reduced prior to vesting; clawback allows for awards to be
reduced and applies for three years after payment of cash or vesting of shares. See last year’s
report for full details.
70 IHG Annual Report and Form 20-F 2015