Holiday Inn 2015 Annual Report Download - page 137
Download and view the complete annual report
Please find page 137 of the 2015 Holiday Inn annual report below. You can navigate through the pages in the report by either clicking on the pages listed below, or by using the keyword search tool below to find specific information within the annual report.-
 1
1 -
2
-
3
-
4
-
5
-
6
-
7
-
8
-
9
-
10
-
11
-
12
-
13
-
14
-
15
-
16
-
17
-
18
-
19
-
20
-
21
-
22
-
23
-
24
-
25
-
26
-
27
-
28
-
29
-
30
-
31
-
32
-
33
-
34
-
35
-
36
-
37
-
38
-
39
-
40
-
41
-
42
-
43
-
44
-
45
-
46
-
47
-
48
-
49
-
50
-
51
-
52
-
53
-
54
-
55
-
56
-
57
-
58
-
59
-
60
-
61
-
62
-
63
-
64
-
65
-
66
-
67
-
68
-
69
-
70
-
71
-
72
-
73
-
74
-
75
-
76
-
77
-
78
-
79
-
80
-
81
-
82
-
83
-
84
-
85
-
86
-
87
-
88
-
89
-
90
-
91
-
92
-
93
-
94
-
95
-
96
-
97
-
98
-
99
-
100
-
101
-
102
-
103
-
104
-
105
-
106
-
107
-
108
-
109
-
110
-
111
-
112
-
113
-
114
-
115
-
116
-
117
-
118
-
119
-
120
-
121
-
122
-
123
-
124
-
125
-
126
-
 127
127 -
 128
128 -
 129
129 -
 130
130 -
 131
131 -
 132
132 -
 133
133 -
 134
134 -
 135
135 -
 136
136 -
 137
137 -
 138
138 -
 139
139 -
 140
140 -
 141
141 -
 142
142 -
 143
143 -
 144
144 -
 145
145 -
 146
146 -
 147
147 -
148
-
149
-
150
-
151
-
152
-
153
-
154
-
155
-
156
-
157
-
158
-
159
-
160
-
161
-
162
-
163
-
164
-
165
-
166
-
167
-
168
-
169
-
170
-
171
-
172
-
173
-
174
-
175
-
176
-
177
-
178
-
179
-
180
-
181
-
182
-
183
-
184
 |
 |

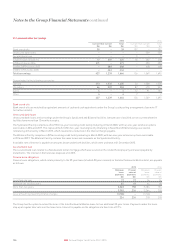
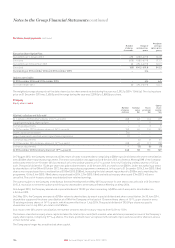
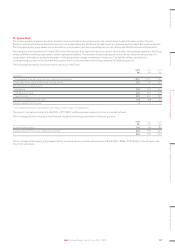
26. Share-based payments continued
The Group recognised a cost of $19m (2014: $21m, 2013: $22m) in operating profit related to equity-settled share-based payment transactions
during the year, net of amounts borne by the SystemFund.
The aggregate consideration in respect of ordinary shares issued under option schemes during the year was $nil (2014: $nil, 2013: $5m).
The following table sets forth awards granted during 2015:
APP LTIP
Number of shares awarded in 2015 265,285 1,803,308
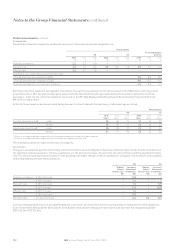
The Group uses separate option pricing models and assumptions depending on the plan. The following table sets out information about awards
granted in 2015, 2014 and 2013:
APP LTIP
Binomial valuation model
Monte Carlo Simulation and
Binomial valuation model
2015 2014 2013 2015 2014 2013
Weighted average share price 2,565.0p 1,925.0p 1,928.0p 2,634.0p 1,916.0p 1,913.0p
Expected dividend yield n/a n/a 2.63% 2.34% 2.55% 2.59%
Risk-free interest rate 0.59% 1.29% 0.27%
Volatilitya22% 28% 28%
Term (years) 3.0 3.0 3.0 3.0 3.0 3.0
a The expected volatility was determined by calculating the historical volatility of the Company’s share price corresponding to the expected life of the share award.
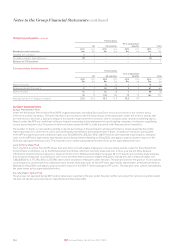
Movements in the awards outstanding under the schemes are as follows:
APP
Number
of shares
thousands
LTIP
Number
of shares
thousands
Outstanding at 1 January 2013 622 7,160
Granted 319 2,227
Vested (72) (2,206)
Lapsed or cancelled (29) (406)
Outstanding at 31 December 2013 840 6,775
Granted 305 2,171
Vested (310) (1,447)
Share capital consolidation (38) –
Lapsed or cancelled (29) (1,379)
Outstanding at 31 December 2014 768 6,120
Granted 265 1,803
Vested (307) (1,278)
Lapsed or cancelled (37) (1,370)
Outstanding at 31 December 2015 689 5,275
Fair value of awards granted during the year (cents) APP LTIP
2015 3,874.5 1,734.5
2014 3,134.6 1,202.1
2013 2,873.4 1,127.9
Weighted average remaining contract life (years) APP LTIP
At 31 December 2015 1.2 1.1
At 31 December 2014 1.1 1.1
At 31 December 2013 1.1 1.1
The above awards do not vest until the performance and service conditions have been met.
STRATEGIC REPORT GOVERNANCE GROUP FINANCIAL STATEMENTS ADDITIONAL INFORMATIONPARENT COMPANY FINANCIAL STATEMENTS
135IHG Annual Report and Form 20-F 2015