Holiday Inn 2015 Annual Report Download - page 116
Download and view the complete annual report
Please find page 116 of the 2015 Holiday Inn annual report below. You can navigate through the pages in the report by either clicking on the pages listed below, or by using the keyword search tool below to find specific information within the annual report.-
 1
1 -
2
-
3
-
4
-
5
-
6
-
7
-
8
-
9
-
10
-
11
-
12
-
13
-
14
-
15
-
16
-
17
-
18
-
19
-
20
-
21
-
22
-
23
-
24
-
25
-
26
-
27
-
28
-
29
-
30
-
31
-
32
-
33
-
34
-
35
-
36
-
37
-
38
-
39
-
40
-
41
-
42
-
43
-
44
-
45
-
46
-
47
-
48
-
49
-
50
-
51
-
52
-
53
-
54
-
55
-
56
-
57
-
58
-
59
-
60
-
61
-
62
-
63
-
64
-
65
-
66
-
67
-
68
-
69
-
70
-
71
-
72
-
73
-
74
-
75
-
76
-
77
-
78
-
79
-
80
-
81
-
82
-
83
-
84
-
85
-
86
-
87
-
88
-
89
-
90
-
91
-
92
-
93
-
94
-
95
-
96
-
97
-
98
-
99
-
100
-
101
-
102
-
103
-
104
-
105
-
 106
106 -
 107
107 -
 108
108 -
 109
109 -
 110
110 -
 111
111 -
 112
112 -
 113
113 -
 114
114 -
 115
115 -
 116
116 -
 117
117 -
 118
118 -
 119
119 -
 120
120 -
 121
121 -
 122
122 -
 123
123 -
 124
124 -
 125
125 -
 126
126 -
127
-
128
-
129
-
130
-
131
-
132
-
133
-
134
-
135
-
136
-
137
-
138
-
139
-
140
-
141
-
142
-
143
-
144
-
145
-
146
-
147
-
148
-
149
-
150
-
151
-
152
-
153
-
154
-
155
-
156
-
157
-
158
-
159
-
160
-
161
-
162
-
163
-
164
-
165
-
166
-
167
-
168
-
169
-
170
-
171
-
172
-
173
-
174
-
175
-
176
-
177
-
178
-
179
-
180
-
181
-
182
-
183
-
184
 |
 |

Notes to the Group Financial Statements continued
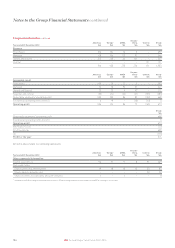
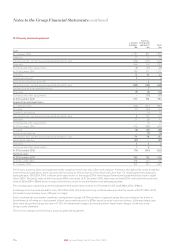
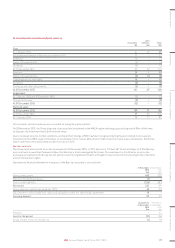
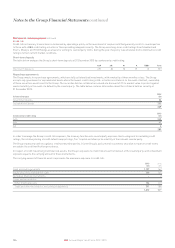
12. Property, plant and equipment
Land and
buildings
$m
Fixtures,
fittings and
equipment
$m
Total
$m
Cost
At 1 January 2014 1,101 871 1,972
Additions 27 52 79
Transfers to non-current assets classified as held for sale (276) (171) (447)
Disposals (144) (61) (205)
Exchange and other adjustments (8) (20) (28)
At 31 December 2014 700 671 1,371
Additions 13 29 42
Capitalised interest 2–2
Acquisition of business (note 10) –33
Transfers to non-current assets classified as held for sale (329) (120) (449)
Reclassification from intangible assets –77
Disposals (9) (3) (12)
Exchange and other adjustments – (11) (11)
At 31 December 2015 377 576 953
Depreciation and impairment
At 1 January 2014 (156) (647) (803)
Provided (11) (32) (43)
System Fund expense –(4)(4)
Transfers to non-current assets classified as held for sale 8 107 115
Disposals 37 58 95
Exchange and other adjustments –1010
At 31 December 2014 (122) (508) (630)
Provided (8) (27) (35)
System Fund expense –(3)(3)
Transfers to non-current assets classified as held for sale 79 78 157
Impairment charges (27) – (27)
Disposals 336
Exchange and other adjustments 167
At 31 December 2015 (74) (451) (525)
Net book value
At 31 December 2015 303 125 428
At 31 December 2014 578 163 741
At 1 January 2014 945 224 1,169
The Group’s property, plant and equipment mainly comprises hotels, but also offices and computer hardware, throughout the world. In addition
to the hotels included above, there was one hotel classified as held for sale at 31 December 2014 (see note 11). Following the hotel disposals
during the year, 43% (2014: 75%) of the net book value relates to the largest (2014: three largest) owned and leased hotel(s) of a total of eight
hotels (2014: 10 hotels), seven of which are open (2014: nine open). At 31 December 2015, there was one hotel (2014: one hotel) with a net book
value of $53m (2014: $36m) which is under construction, not yet in use and therefore not being depreciated.
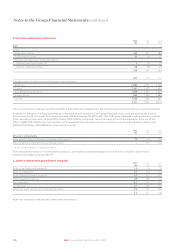
The carrying value of property, plant and equipment held under finance leases at 31 December 2015 was $184m (2014: $186m).
Including assets classified as held for sale, 22% (2014: 40%) of hotel properties by net book value were directly owned, with 59% (2014:22%)
held under leases having a term of 50 years or longer.
Due to localised adverse market conditions, an impairment charge of $27m has been recognised during the year relating to two hotels in
North America following a re-assessment of their recoverable amounts to $37m, based on value in use calculations. Estimated future cash
flows were discounted at a pre-tax rate of 11.75%. All impairment charges are included within ‘impairment charges’ on the face of the
Group income statement.
There are no charges over the Group’s property, plantandequipment.
114 IHG Annual Report and Form 20-F 2015