Holiday Inn 2015 Annual Report Download - page 48
Download and view the complete annual report
Please find page 48 of the 2015 Holiday Inn annual report below. You can navigate through the pages in the report by either clicking on the pages listed below, or by using the keyword search tool below to find specific information within the annual report.-
 1
1 -
2
-
3
-
4
-
5
-
6
-
7
-
8
-
9
-
10
-
11
-
12
-
13
-
14
-
15
-
16
-
17
-
18
-
19
-
20
-
21
-
22
-
23
-
24
-
25
-
26
-
27
-
28
-
29
-
30
-
31
-
32
-
33
-
34
-
35
-
36
-
37
-
 38
38 -
 39
39 -
 40
40 -
 41
41 -
 42
42 -
 43
43 -
 44
44 -
 45
45 -
 46
46 -
 47
47 -
 48
48 -
 49
49 -
 50
50 -
 51
51 -
 52
52 -
 53
53 -
 54
54 -
 55
55 -
 56
56 -
 57
57 -
 58
58 -
59
-
60
-
61
-
62
-
63
-
64
-
65
-
66
-
67
-
68
-
69
-
70
-
71
-
72
-
73
-
74
-
75
-
76
-
77
-
78
-
79
-
80
-
81
-
82
-
83
-
84
-
85
-
86
-
87
-
88
-
89
-
90
-
91
-
92
-
93
-
94
-
95
-
96
-
97
-
98
-
99
-
100
-
101
-
102
-
103
-
104
-
105
-
106
-
107
-
108
-
109
-
110
-
111
-
112
-
113
-
114
-
115
-
116
-
117
-
118
-
119
-
120
-
121
-
122
-
123
-
124
-
125
-
126
-
127
-
128
-
129
-
130
-
131
-
132
-
133
-
134
-
135
-
136
-
137
-
138
-
139
-
140
-
141
-
142
-
143
-
144
-
145
-
146
-
147
-
148
-
149
-
150
-
151
-
152
-
153
-
154
-
155
-
156
-
157
-
158
-
159
-
160
-
161
-
162
-
163
-
164
-
165
-
166
-
167
-
168
-
169
-
170
-
171
-
172
-
173
-
174
-
175
-
176
-
177
-
178
-
179
-
180
-
181
-
182
-
183
-
184
 |
 |

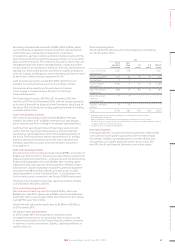
Performance continued
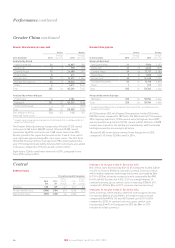
Greater China hotel and room count
Hotels Rooms
At 31 December 2015
Change
over 2014 2015
Change
over 2014
Analysed by brand
InterContinental 34 1 13,807 265
HUALUXE 3 3 798 798
Crowne Plaza 75 2 26,688 575
Hotel Indigo 5 – 611 (1)
Holiday Inna 78 5 24,971 1,564
Holiday Inn Express 64 9 16,023 1,947
Other 6 4 2,611 2,167
Total 265 24 85,509 7,315
Analysed by ownership type
Franchised 4– 2,184 –
Managed 261 25 83,325 7,818
Owned and leased –(1) – (503)
Total 265 24 85,509 7,315
Percentage of Group
hotel and room count
5.3 0.3 11.5 0.5
a Includes seven Holiday Inn Resort properties (2,235 rooms) (2014: six Holiday Inn Resort
properties (1,825 rooms)).
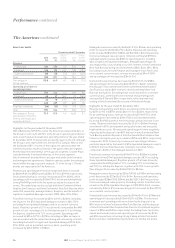
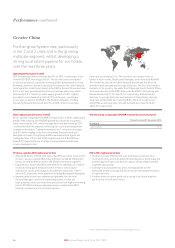
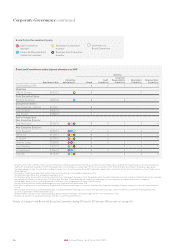
The Greater China System size increased by 24 hotels (7,315 rooms)
in the year to 265 hotels (85,509 rooms). 32 hotels (9,380 rooms)
opened during 2015, two hotels and 1,268 rooms lower than 2014.
Recent growth in the region has focused on tier 2 and 3 cities, which
now represent approximately 68% of our open rooms. The first three
HUALUXE Hotels and Resorts properties (798 rooms) opened in the
year. 19 Holiday Inn brand family hotels (4,567 rooms) were also added
in the year, compared to 19 hotels (4,445 rooms) in 2014.
Eight hotels (2,065 rooms) were removed in 2015, compared to one
hotel (999 rooms) in 2014.
Greater China pipeline
Hotels Rooms
At 31 December 2015
Change
over 2014 2015
Change
over 2014
Analysed by brand
InterContinental 21 3 7,900 1,222
HUALUXE 21 (3) 6,632 (919)
Crowne Plaza 39 (5) 12,717 (2,084)
Hotel Indigo 9 (1) 1,500 (146)
Holiday Innb 49 6 14,638 2,254
Holiday Inn Express 65 15 15,118 3,840
Other 11 279 279
Total 205 16 58,784 4,446
Analysed by ownership type
Managed 205 16 58,784 4,446
Total 205 16 58,784 4,446
b Includes three Holiday Inn Resort properties (820 rooms) (2014: two Holiday Inn Resort
properties (767 rooms)).
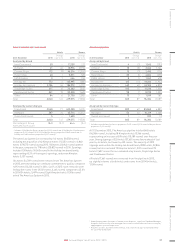
At 31 December 2015, the Greater China pipeline totalled 205 hotels
(58,784 rooms) compared to 189 hotels (54,338 rooms) at 31 December
2014. Signings (66 hotels, 19,516 rooms) were the highest since 2007,
and increased from 64 hotels (15,754 rooms) in 2014. 48 hotels (12,878
rooms) were signed for the Holiday Inn brand family, with the Holiday
Inn Express pipeline increasing to 65 hotels.
18 hotels (5,690 rooms) were removed from the pipeline in 2015,
compared to 15 hotels (5,358 rooms) in 2014.
Greater China continued
Central
Central results
12 months ended 31 December
2015
$m
2014
$m
2015 vs
2014 %
change
2013
$m
2014 vs
2013 %
change
Revenue 135 129 4.7 121 6.6
Gross central costs (286) (284) (0.7) (276) (2.9)
Net central costs (151) (155) 2.6 (155) –
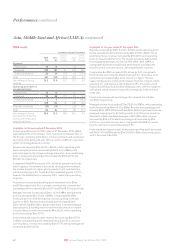
Highlights for the year ended 31 December 2015
Net central costs decreased by $4m (2.6%) compared to 2014 (a $5m
or 3.2% increase to $160m at constant currency). Central revenue,
which mainly comprises technology fee income, increased by $6m
(4.7%) to $135m, driven by increases in both comparable RevPAR
(4.4%) and IHG System size (4.8%, 3.2% excluding Kimpton). At
constant currency, gross central costs increased by $13m (4.6%)
compared to 2014 (a $2m or 0.7% increase at actual currency).
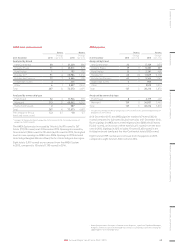
Highlights for the year ended 31 December 2014
Central revenue, which mainly comprises technology fee income,
increased by $8m (6.6%) to $129m, driven by increases in both
comparable RevPAR (6.1%) and IHG System size (3.4%) in 2014
compared to 2013. At constant currency, gross central costs
increased by $4m (1.4%) compared to 2013 (an $8m or 2.9%
increase at actual currency).
46 IHG Annual Report and Form 20-F 2015