Holiday Inn 2015 Annual Report Download - page 135
Download and view the complete annual report
Please find page 135 of the 2015 Holiday Inn annual report below. You can navigate through the pages in the report by either clicking on the pages listed below, or by using the keyword search tool below to find specific information within the annual report.-
 1
1 -
2
-
3
-
4
-
5
-
6
-
7
-
8
-
9
-
10
-
11
-
12
-
13
-
14
-
15
-
16
-
17
-
18
-
19
-
20
-
21
-
22
-
23
-
24
-
25
-
26
-
27
-
28
-
29
-
30
-
31
-
32
-
33
-
34
-
35
-
36
-
37
-
38
-
39
-
40
-
41
-
42
-
43
-
44
-
45
-
46
-
47
-
48
-
49
-
50
-
51
-
52
-
53
-
54
-
55
-
56
-
57
-
58
-
59
-
60
-
61
-
62
-
63
-
64
-
65
-
66
-
67
-
68
-
69
-
70
-
71
-
72
-
73
-
74
-
75
-
76
-
77
-
78
-
79
-
80
-
81
-
82
-
83
-
84
-
85
-
86
-
87
-
88
-
89
-
90
-
91
-
92
-
93
-
94
-
95
-
96
-
97
-
98
-
99
-
100
-
101
-
102
-
103
-
104
-
105
-
106
-
107
-
108
-
109
-
110
-
111
-
112
-
113
-
114
-
115
-
116
-
117
-
118
-
119
-
120
-
121
-
122
-
123
-
124
-
 125
125 -
 126
126 -
 127
127 -
 128
128 -
 129
129 -
 130
130 -
 131
131 -
 132
132 -
 133
133 -
 134
134 -
 135
135 -
 136
136 -
 137
137 -
 138
138 -
 139
139 -
 140
140 -
 141
141 -
 142
142 -
 143
143 -
 144
144 -
 145
145 -
146
-
147
-
148
-
149
-
150
-
151
-
152
-
153
-
154
-
155
-
156
-
157
-
158
-
159
-
160
-
161
-
162
-
163
-
164
-
165
-
166
-
167
-
168
-
169
-
170
-
171
-
172
-
173
-
174
-
175
-
176
-
177
-
178
-
179
-
180
-
181
-
182
-
183
-
184
 |
 |

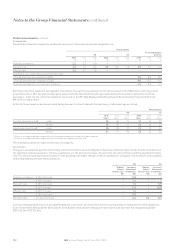
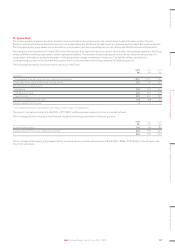
25. Retirement benefits continued
Movement in benefit obligation
Pension plans
UK US and other
Post-employment
benefits Total
2015
$m
2014
$m
2015
$m
2014
$m
2015
$m
2014
$m
2015
$m
2014
$m
Benefit obligation at 1 January 31 659 255 233 24 24 310 916
Current service cost –––1–––1
Interest expense 124 810 1110 35
Settlement gain before costs –(3) (2) –––(2) (3)
Benefits paid –(18) (14) (14) (1) (1) (15) (33)
Committed cash-out payments –(57) (11) –––(11) (57)
Re-measurement (gains)/losses (4) 86 (10) 26 (3) –(17) 112
Derecognised on buy-out –(640) (11) –––(11) (640)
Transfers to non-current assets classified as held for sale ––(12) –––(12) –
Exchange adjustments (1) (20) (1) (1) ––(2) (21)
Benefit obligation at 31 December 27 31 202 255 21 24 250 310
Comprising:
Funded plans ––150 199 ––150 199
Unfunded plans 27 31 52 56 21 24 100 111
27 31 202 255 21 24 250 310
Movement in plan assets
Pension plans
UK US and other
Post-employment
benefits Total
2015
$m
2014
$m
2015
$m
2014
$m
2015
$m
2014
$m
2015
$m
2014
$m
Fair value of plan assets at 1 January 8582 167 159 ––175 741
Company contributions –3811 11915
Benefits paid –(18) (14) (14) (1) (1) (15) (33)
Interest income –22 57––529
Re-measurement gains/(losses) –83 (7) 5––(7) 88
Administration costs (1) (3) (1) –––(2) (3)
Derecognised on buy-out –(640) (22) –––(22) (640)
Transfer to defined contribution plan (7) –––––(7) –
Transfers to non-current assets classified as held for sale ––(15) –––(15) –
Exchange adjustments –(21) –(1) –––(22)
Fair value of plan assets at 31 December – 8121 167 ––121 175
Company contributions are expected to be $9m in 2016.
The plan assets are measured at fair value and comprise the following:
UK US and other
2015
$m
2014
$m
2015
$m
2014
$m
Investments quoted in active markets
Investment funds:
Global equities ––17 21
Corporate bonds ––101 131
Property ––22
Unquoted investments
Qualifying insurance policy –––11
Cash and other –812
–8121 167
In accordance with accounting standards, the fair value of a qualifying insurance policy is deemed to be the present value of the pension
obligations secured by thatpolicy.
STRATEGIC REPORT GOVERNANCE GROUP FINANCIAL STATEMENTS ADDITIONAL INFORMATIONPARENT COMPANY FINANCIAL STATEMENTS
133IHG Annual Report and Form 20-F 2015