Holiday Inn 2015 Annual Report Download - page 107
Download and view the complete annual report
Please find page 107 of the 2015 Holiday Inn annual report below. You can navigate through the pages in the report by either clicking on the pages listed below, or by using the keyword search tool below to find specific information within the annual report.-
 1
1 -
2
-
3
-
4
-
5
-
6
-
7
-
8
-
9
-
10
-
11
-
12
-
13
-
14
-
15
-
16
-
17
-
18
-
19
-
20
-
21
-
22
-
23
-
24
-
25
-
26
-
27
-
28
-
29
-
30
-
31
-
32
-
33
-
34
-
35
-
36
-
37
-
38
-
39
-
40
-
41
-
42
-
43
-
44
-
45
-
46
-
47
-
48
-
49
-
50
-
51
-
52
-
53
-
54
-
55
-
56
-
57
-
58
-
59
-
60
-
61
-
62
-
63
-
64
-
65
-
66
-
67
-
68
-
69
-
70
-
71
-
72
-
73
-
74
-
75
-
76
-
77
-
78
-
79
-
80
-
81
-
82
-
83
-
84
-
85
-
86
-
87
-
88
-
89
-
90
-
91
-
92
-
93
-
94
-
95
-
96
-
 97
97 -
 98
98 -
 99
99 -
 100
100 -
 101
101 -
 102
102 -
 103
103 -
 104
104 -
 105
105 -
 106
106 -
 107
107 -
 108
108 -
 109
109 -
 110
110 -
 111
111 -
 112
112 -
 113
113 -
 114
114 -
 115
115 -
 116
116 -
 117
117 -
118
-
119
-
120
-
121
-
122
-
123
-
124
-
125
-
126
-
127
-
128
-
129
-
130
-
131
-
132
-
133
-
134
-
135
-
136
-
137
-
138
-
139
-
140
-
141
-
142
-
143
-
144
-
145
-
146
-
147
-
148
-
149
-
150
-
151
-
152
-
153
-
154
-
155
-
156
-
157
-
158
-
159
-
160
-
161
-
162
-
163
-
164
-
165
-
166
-
167
-
168
-
169
-
170
-
171
-
172
-
173
-
174
-
175
-
176
-
177
-
178
-
179
-
180
-
181
-
182
-
183
-
184
 |
 |

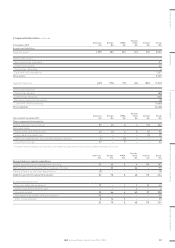
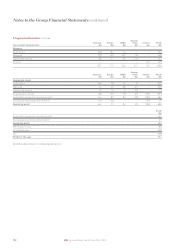
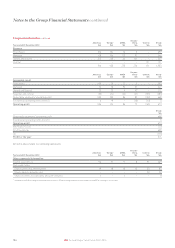
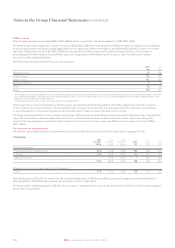
2. Segmental information continued
Geographical information
Year ended
31 December
2015
$m
Year ended
31 December
2014
$m
Year ended
31 December
2013
$m
Revenue
United Kingdom 67 75 90
United States 876 786 843
People’s Republic of China (including Hong Kong) 223 254 247
Rest of World 637 743 723
1,803 1,858 1,903
For the purposes of the above table, hotel revenue is determined according to the location of the hotel and other revenue is attributed to the
country of origin. In addition to the United Kingdom, revenue relating to an individual country is separately disclosed when it represents 10%
or more of total revenue.
31 December
2015
$m
31 December
2014
$m
Non-current assets
United Kingdom 126 136
United States 1,265 811
People’s Republic of China (including Hong Kong) 83 318
Rest of World 319 238
1,793 1,503
For the purposes of the above table, non-current assets comprise property, plant and equipment, goodwill, intangible assets, investments in
associates and joint ventures and trade and other receivables. In addition to the United Kingdom, non-current assets relating to an individual
country are separately disclosed when they represent 10% or more of total non-current assets, as defined above.
STRATEGIC REPORT GOVERNANCE GROUP FINANCIAL STATEMENTS ADDITIONAL INFORMATIONPARENT COMPANY FINANCIAL STATEMENTS
105IHG Annual Report and Form 20-F 2015