Holiday Inn 2015 Annual Report Download - page 12
Download and view the complete annual report
Please find page 12 of the 2015 Holiday Inn annual report below. You can navigate through the pages in the report by either clicking on the pages listed below, or by using the keyword search tool below to find specific information within the annual report.-
 1
1 -
 2
2 -
 3
3 -
 4
4 -
 5
5 -
 6
6 -
 7
7 -
 8
8 -
 9
9 -
 10
10 -
 11
11 -
 12
12 -
 13
13 -
 14
14 -
 15
15 -
 16
16 -
 17
17 -
 18
18 -
 19
19 -
 20
20 -
 21
21 -
 22
22 -
23
-
24
-
25
-
26
-
27
-
28
-
29
-
30
-
31
-
32
-
33
-
34
-
35
-
36
-
37
-
38
-
39
-
40
-
41
-
42
-
43
-
44
-
45
-
46
-
47
-
48
-
49
-
50
-
51
-
52
-
53
-
54
-
55
-
56
-
57
-
58
-
59
-
60
-
61
-
62
-
63
-
64
-
65
-
66
-
67
-
68
-
69
-
70
-
71
-
72
-
73
-
74
-
75
-
76
-
77
-
78
-
79
-
80
-
81
-
82
-
83
-
84
-
85
-
86
-
87
-
88
-
89
-
90
-
91
-
92
-
93
-
94
-
95
-
96
-
97
-
98
-
99
-
100
-
101
-
102
-
103
-
104
-
105
-
106
-
107
-
108
-
109
-
110
-
111
-
112
-
113
-
114
-
115
-
116
-
117
-
118
-
119
-
120
-
121
-
122
-
123
-
124
-
125
-
126
-
127
-
128
-
129
-
130
-
131
-
132
-
133
-
134
-
135
-
136
-
137
-
138
-
139
-
140
-
141
-
142
-
143
-
144
-
145
-
146
-
147
-
148
-
149
-
150
-
151
-
152
-
153
-
154
-
155
-
156
-
157
-
158
-
159
-
160
-
161
-
162
-
163
-
164
-
165
-
166
-
167
-
168
-
169
-
170
-
171
-
172
-
173
-
174
-
175
-
176
-
177
-
178
-
179
-
180
-
181
-
182
-
183
-
184
 |
 |

I
I
I
n
d
u
u
st
r
r
y
o
v
v
er
v
v
ie
w
w
w
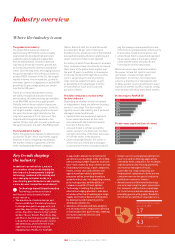
Key trends shaping
the industry
In addition to growth drivers, we also
see a number of key trends shaping the
hotel industry. Developments in digital
technology, combined with evolving and
ever-changing consumer needs, are
transforming guest behaviours and creating
a more dynamic competitive environment.
Technology-based transformation
Technology continues to have a
multifaceted and substantial impact
on our industry:
• The prevalence of mobile devices and
the accessibility of the internet continue
to change how guests engage with, and
what they expect from, lodging providers
across the entire ‘Guest Journey’ (which
we describe as ‘Dream, Plan, Book, Stay
and Share’). Technology is enabling guests
to book their travel with greater control
and immediacy, and share their travel
experiences in more practical and
engaging ways. Mobile, for example,
is expected to deliver more than half of
all online travel bookings in the US in 2016,
and a growing number of guests now book
their rooms within 24 hours of their arrival.
• Enabled by technology, travel companies,
hotels, review sites and online travel
agents have been able to grow their
presence online, providing travellers
globally with access to compelling content,
price transparency and the ability to
compare a wealth of travel options.
• Technology is fuelling the growth of
alternative lodging providers, who have
also been effective at opening up a large
supply of private urban accommodation
by developing and marketing online
distribution platforms.
• Advances in big data and data analytics
are allowing travel companies to develop
richer insights into guest needs, enabling
more personalised services and
tailored offers.
Connected devices per
person in 2015:
1.7
and in 2020 (predicted):
4.3
(Source: Strategy Analytics)
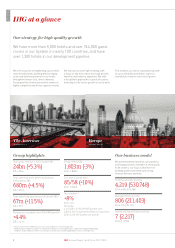
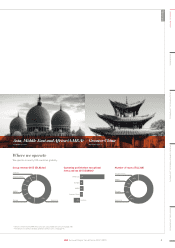
Where the industry is now
The global hotel industry
The global hotel industry comprises
approximately 15.9 million rooms, broadly
segmented into branded (multiple hotels
under the same brand) and independent
(non-branded) hotels. Growth in demand
is primarily driven by economic growth and
an increasing trend for domestic and global
travel. Over the long term, the lodging industry
has grown broadly in line with gross domestic
product (GDP). However, in the US, the largest
market in terms of room numbers, growth in
consumer spend on lodging has exceeded GDP
growth by 2.6 percentage points per annum
over the last 50 years.
There are several industry metrics that
are widely recognised and used to track
performance, including revenue per available
room (RevPAR) and rooms supply growth.
Globally, both of these indicators have seen
robust growth in the last five years. In the US,
our largest market, supply growth in the last
five years has been significantly below the
long-term average of 2 to 2.1 per cent. This,
coupled with strong hotel demand in this
market (3.3 per cent year-on-year growth over
the past five years), has led to RevPAR growth.
The branded hotel market
Within the global hotel market, branded hotels
account for 53 per cent of total rooms supply.
However, in spite of ongoing consolidation,
the market remains fragmented, with five
of the leading branded hotel companies
(Hilton, Marriott, IHG, Accor and Starwood)
accounting for 36 per cent of total open
branded rooms, and 61 per cent of the branded
development pipeline (hotels in planning and
under construction but not yet opened).
According to Smith Travel Research, branded
hotel companies have consistently increased
their share of the global hotel market over
the past 10 years, in addition to showing an
increased resilience through the economic
cycles. Larger players are also driving
clear revenue outperformance, as well
as benefiting from advantages in terms
of economies of scale across a broad
portfolio of hotels.
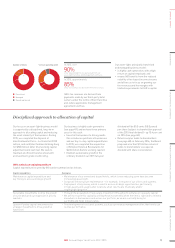
The different business models within
the hotel industry
Depending on whether a hotel is branded
or independent, there are different business
models it can adopt. The four models
typically seen in the industry are franchised,
managed, owned and leased:
• owned hotels are owned and operated
by an owner who bears all the costs
associated with the hotel but benefits
from all of the income;
• a leased model is similar, except the
owner-operator of a hotel does not have
outright ownership of the hotel but leases
it from the owner of the property;
• under a managed model, the owner of
a hotel will use a third-party manager
to operate the hotel on its behalf and will
pay the manager management fees and,
if the hotel is operated under a third-party
brand name, brand licensing fees; and
• a franchised hotel is owned and operated
by an owner under a third-party brand
name and the owner will pay a brand
licensing fee to the brand owner.
Whilst an owner-operated hotel enables
the owner to have full control over hotel
operations, it requires high capital
investment. In contrast, for hotel-brand
owners, a franchised or managed model
enables quicker rooms growth due to lower
capital investment, but this requires strong
relationships with third-party hotel owners.
Global industry RevPAR ($)
2014
2013
2012
2011
2010
2015 81.5
77.3
73.1
71.0
68.9
66.1
Global rooms supply (millions of rooms)
15.9
15.6
15.3
15.1
14.8
14.6
2014
2013
2012
2011
2010
2015
• Owners are increasingly benefiting from
new tools and technology applications
offered by hotel companies. For example,
sophisticated online training platforms
and revenue management tools,
accessible via cloud computing, are
helping hotel companies to drive a more
consistent service for guests and more
profitable revenue for owners.
• Advancements within hotel technology
are also improving the guest experience.
For example, mobile check-in and apps
for room service and housekeeping are
providing guests with greater flexibility
and choice around their stay experience.
10 IHG Annual Report and Form 20-F 2015