Holiday Inn 2015 Annual Report Download - page 15
Download and view the complete annual report
Please find page 15 of the 2015 Holiday Inn annual report below. You can navigate through the pages in the report by either clicking on the pages listed below, or by using the keyword search tool below to find specific information within the annual report.-
 1
1 -
2
-
3
-
4
-
 5
5 -
 6
6 -
 7
7 -
 8
8 -
 9
9 -
 10
10 -
 11
11 -
 12
12 -
 13
13 -
 14
14 -
 15
15 -
 16
16 -
 17
17 -
 18
18 -
 19
19 -
 20
20 -
 21
21 -
 22
22 -
 23
23 -
 24
24 -
 25
25 -
26
-
27
-
28
-
29
-
30
-
31
-
32
-
33
-
34
-
35
-
36
-
37
-
38
-
39
-
40
-
41
-
42
-
43
-
44
-
45
-
46
-
47
-
48
-
49
-
50
-
51
-
52
-
53
-
54
-
55
-
56
-
57
-
58
-
59
-
60
-
61
-
62
-
63
-
64
-
65
-
66
-
67
-
68
-
69
-
70
-
71
-
72
-
73
-
74
-
75
-
76
-
77
-
78
-
79
-
80
-
81
-
82
-
83
-
84
-
85
-
86
-
87
-
88
-
89
-
90
-
91
-
92
-
93
-
94
-
95
-
96
-
97
-
98
-
99
-
100
-
101
-
102
-
103
-
104
-
105
-
106
-
107
-
108
-
109
-
110
-
111
-
112
-
113
-
114
-
115
-
116
-
117
-
118
-
119
-
120
-
121
-
122
-
123
-
124
-
125
-
126
-
127
-
128
-
129
-
130
-
131
-
132
-
133
-
134
-
135
-
136
-
137
-
138
-
139
-
140
-
141
-
142
-
143
-
144
-
145
-
146
-
147
-
148
-
149
-
150
-
151
-
152
-
153
-
154
-
155
-
156
-
157
-
158
-
159
-
160
-
161
-
162
-
163
-
164
-
165
-
166
-
167
-
168
-
169
-
170
-
171
-
172
-
173
-
174
-
175
-
176
-
177
-
178
-
179
-
180
-
181
-
182
-
183
-
184
 |
 |

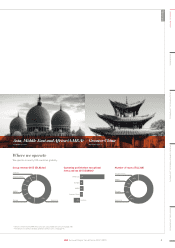
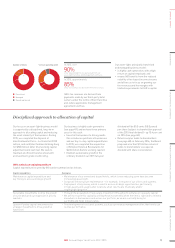
7
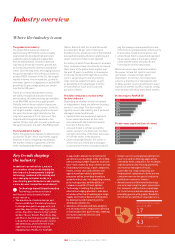
4,219
69%
806
25%
6%
Franchised
Managed
Owned and leased
Number of hotels % of our operating profit In 2015, over
90%
of our operating profit was generated from our
asset-light franchise and management contracts.
In 2015, approximately
85%
of our fee revenue was derived from hotel revenues.
Disciplined approach to allocation of capital
Our business is highly cash-generative
(see page 49), and we have three primary
uses for this cash:
• Invest in the business to drive growth:
this includes acquisitions of businesses
and our day-to-day capital expenditures.
In 2015, we completed the acquisition
of Kimpton Hotels & Restaurants for
$430 million (before working capital).
• Maintain sustainable growth in the
ordinary dividend: our 2015 full-year
Our asset-light, principally franchised
and managed business model:
• is highly cash-generative, with a high
return on capital employed; and
• means IHG benefits from the reduced
volatility of fee-based income streams
and allows us to focus on growing our
fee revenues and fee margins with
limited requirements for IHG’s capital.
dividend will be 85.0 cents (58.0 pence)
per share (subject to shareholder approval
of the 2015 final dividend) – up 10.4 per cent
on 2014 (see page 48).
• Return surplus funds to shareholders
(see page 48): in February 2016, the Board
proposed a further $1.5 billion return of
funds to shareholders via a special
dividend with share consolidation.
Our focus on an asset-light business model
is supported by a disciplined, long-term
approach to allocating capital and reducing
the asset intensity of the business. During
2015, we completed the disposal of
InterContinental Paris – Le Grand for €330
million, and sold InterContinental Hong Kong
for $928 million (after final working capital
adjustments and cash tax). We seek to
maintain an efficient balance sheet with
an investment-grade credit rating.
IHG’s outlook on capital expenditure
Capital expenditure incurred by IHG can be summarised as follows.
Capital expenditure Examples
Maintenance capital expenditure and
key money to access strategic growth
• Maintenance of our owned and leased hotels, which is now reducing as we have become
increasingly asset-light.
• Corporate infrastructure maintenance – for example, in respect of our offices and systems.
• Deployment of key money, which is used to access strategic opportunities, particularly
in high-quality and sought-after locations when returns are financially and/or
strategically attractive.
Recyclable investments to drive the growth
of our brands and our expansion in priority
markets
• Through the acquisition of real estate, investment through joint ventures or via equity capital.
• We aim to recycle this capital by selling these investments when the time is right and to reinvest
elsewhere in the business and across our portfolio, as we are currently doing for
our EVEN and Hotel Indigo brands.
System-Funded capital investments for
strategic investment to drive growth at
hotel level
• The development of tools and systems, such as our revenue management offer, that hotels use
to drive performance.
IHG’s fee revenues are derived from
payments made by our third-party hotel
owners under the terms of their franchise
and, where applicable, management
agreements with us.
13
IHG Annual Report and Form 20-F 2015
STRATEGIC REPORT GOVERNANCE GROUP FINANCIAL STATEMENTS ADDITIONAL INFORMATIONPARENT COMPANY FINANCIAL STATEMENTS