Holiday Inn 2015 Annual Report Download - page 121
Download and view the complete annual report
Please find page 121 of the 2015 Holiday Inn annual report below. You can navigate through the pages in the report by either clicking on the pages listed below, or by using the keyword search tool below to find specific information within the annual report.-
 1
1 -
2
-
3
-
4
-
5
-
6
-
7
-
8
-
9
-
10
-
11
-
12
-
13
-
14
-
15
-
16
-
17
-
18
-
19
-
20
-
21
-
22
-
23
-
24
-
25
-
26
-
27
-
28
-
29
-
30
-
31
-
32
-
33
-
34
-
35
-
36
-
37
-
38
-
39
-
40
-
41
-
42
-
43
-
44
-
45
-
46
-
47
-
48
-
49
-
50
-
51
-
52
-
53
-
54
-
55
-
56
-
57
-
58
-
59
-
60
-
61
-
62
-
63
-
64
-
65
-
66
-
67
-
68
-
69
-
70
-
71
-
72
-
73
-
74
-
75
-
76
-
77
-
78
-
79
-
80
-
81
-
82
-
83
-
84
-
85
-
86
-
87
-
88
-
89
-
90
-
91
-
92
-
93
-
94
-
95
-
96
-
97
-
98
-
99
-
100
-
101
-
102
-
103
-
104
-
105
-
106
-
107
-
108
-
109
-
110
-
 111
111 -
 112
112 -
 113
113 -
 114
114 -
 115
115 -
 116
116 -
 117
117 -
 118
118 -
 119
119 -
 120
120 -
 121
121 -
 122
122 -
 123
123 -
 124
124 -
 125
125 -
 126
126 -
 127
127 -
 128
128 -
 129
129 -
 130
130 -
 131
131 -
132
-
133
-
134
-
135
-
136
-
137
-
138
-
139
-
140
-
141
-
142
-
143
-
144
-
145
-
146
-
147
-
148
-
149
-
150
-
151
-
152
-
153
-
154
-
155
-
156
-
157
-
158
-
159
-
160
-
161
-
162
-
163
-
164
-
165
-
166
-
167
-
168
-
169
-
170
-
171
-
172
-
173
-
174
-
175
-
176
-
177
-
178
-
179
-
180
-
181
-
182
-
183
-
184
 |
 |

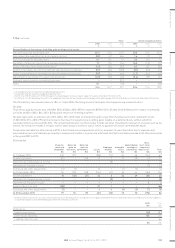
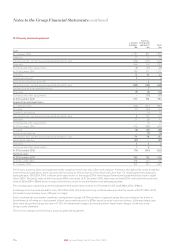
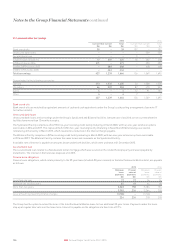
16. Trade and other receivables
2015
$m
2014
$m
Current
Trade receivables 354 327
Other receivables 28 47
Prepayments 74 63
Loans to and receivables from associates 611
462 448
Non-current
Loans to associates 33
Trade and other receivables are designated as loans and receivables and are held at amortised cost.
Trade receivables are non-interest-bearing and are generally on payment terms of up to 30 days. The fair value of trade and other receivables
approximates their carrying value.
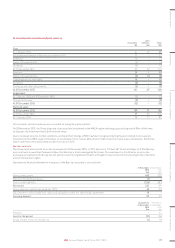
The maximum exposure to credit risk for trade and other receivables, excluding prepayments, at the end of the reporting period by geographic
region is:
2015
$m
2014
$m
Americas 233 221
Europe 54 76
Asia, Middle East and Africa 66 53
Greater China 38 38
391 388
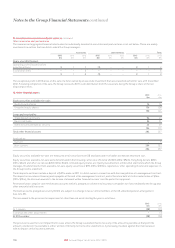
The ageing of trade and other receivables, excluding prepayments, at the end of the reporting period is:
2015 2014
Gross
$m
Provision
$m
Net
$m
Gross
$m
Provision
$m
Net
$m
Not past due 280 (1) 279 275 – 275
Past due 1 to 30 days 64 (3) 61 57 (3) 54
Past due 31 to 180 days 52 (5) 47 57 (3) 54
Past due more than 180 days 51 (47) 4 46 (41) 5
447 (56) 391 435 (47) 388
The credit risk relating to balances not past due is not deemed to be significant.
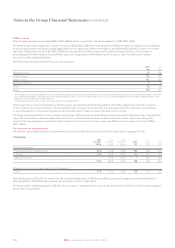
The movement in the provision for impairment of trade and other receivables during the year is as follows:
2015
$m
2014
$m
2013
$m
At 1 January (47) (43) (47)
Provided (28) (22) (18)
Amounts written back 12 914
Amounts written off 798
At 31 December (56) (47) (43)
STRATEGIC REPORT GOVERNANCE GROUP FINANCIAL STATEMENTS ADDITIONAL INFORMATIONPARENT COMPANY FINANCIAL STATEMENTS
119IHG Annual Report and Form 20-F 2015