Holiday Inn 2015 Annual Report Download - page 131
Download and view the complete annual report
Please find page 131 of the 2015 Holiday Inn annual report below. You can navigate through the pages in the report by either clicking on the pages listed below, or by using the keyword search tool below to find specific information within the annual report.-
 1
1 -
2
-
3
-
4
-
5
-
6
-
7
-
8
-
9
-
10
-
11
-
12
-
13
-
14
-
15
-
16
-
17
-
18
-
19
-
20
-
21
-
22
-
23
-
24
-
25
-
26
-
27
-
28
-
29
-
30
-
31
-
32
-
33
-
34
-
35
-
36
-
37
-
38
-
39
-
40
-
41
-
42
-
43
-
44
-
45
-
46
-
47
-
48
-
49
-
50
-
51
-
52
-
53
-
54
-
55
-
56
-
57
-
58
-
59
-
60
-
61
-
62
-
63
-
64
-
65
-
66
-
67
-
68
-
69
-
70
-
71
-
72
-
73
-
74
-
75
-
76
-
77
-
78
-
79
-
80
-
81
-
82
-
83
-
84
-
85
-
86
-
87
-
88
-
89
-
90
-
91
-
92
-
93
-
94
-
95
-
96
-
97
-
98
-
99
-
100
-
101
-
102
-
103
-
104
-
105
-
106
-
107
-
108
-
109
-
110
-
111
-
112
-
113
-
114
-
115
-
116
-
117
-
118
-
119
-
120
-
 121
121 -
 122
122 -
 123
123 -
 124
124 -
 125
125 -
 126
126 -
 127
127 -
 128
128 -
 129
129 -
 130
130 -
 131
131 -
 132
132 -
 133
133 -
 134
134 -
 135
135 -
 136
136 -
 137
137 -
 138
138 -
 139
139 -
 140
140 -
 141
141 -
142
-
143
-
144
-
145
-
146
-
147
-
148
-
149
-
150
-
151
-
152
-
153
-
154
-
155
-
156
-
157
-
158
-
159
-
160
-
161
-
162
-
163
-
164
-
165
-
166
-
167
-
168
-
169
-
170
-
171
-
172
-
173
-
174
-
175
-
176
-
177
-
178
-
179
-
180
-
181
-
182
-
183
-
184
 |
 |

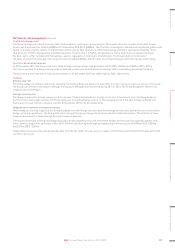
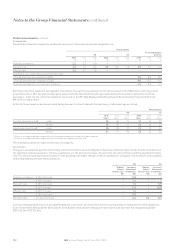
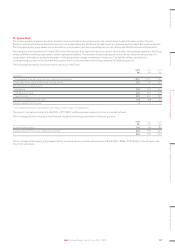
23. Fair value measurement continued
There were no transfers between Level 1 and Level 2 fair value measurements during the year and no transfers into and out of Level 3.
The fair value of quoted equity shares and the bonds is based on their quoted market price.
Derivatives are fair valued using discounted future cash flows, taking into consideration exchange rates prevailing on the last day of the
reporting period and interest rates from observable swap curves.
Finance lease obligations relate primarily to the lease of InterContinental Boston, which is fair valued by discounting the future cash flows
payable under the loan, which are fixed, at a risk adjusted long-term interest rate. The interest rate used to discount the cash flows at
31 December 2015 was 7.0% (2014: 7.4%).
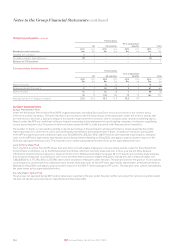
Unquoted equity shares are fair valued using the International Private Equity and Venture Capital Valuation Guidelines either by applying an
average price-earnings (P/E) ratio for a competitor group to the earnings generated by the investment or by reference to share of net assets
if the investment is currently loss-making or a recent property valuation is available. The average P/E ratio for the year was 21.9 (2014: 24.0)
and anon-marketability factor of 30% (2014: 30%) is applied. A 10% increase in the average P/E ratio would result in a $3m increase (2014: $3m)
in the fair value of the investments and a 10% decrease in the average P/E ratio would result in a $3m decrease (2014: $3m) in the fair value
of the investments. A 10% increase in net assets would result in a $8m increase (2014: $7m) in the fair value of the investments and a 10%
decrease in net assets would result in a $8m decrease (2014: $7m) in the fair value of the investments.
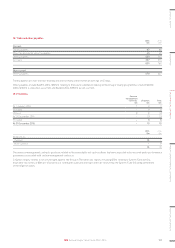
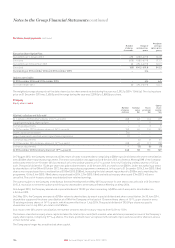
The following table reconciles the movements in the fair values of investments classified as Level 3 during the year:
2015
$m
2014
$m
At 1 January 128 127
Additions 55
Repaid –(8)
Valuation gains recognised in other comprehensive income 47
Exchange and other adjustments (1) (3)
At 31 December 136 128
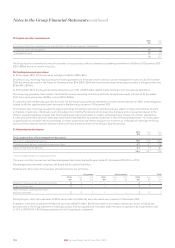
24. Net debt
2015
$m
2014
$m
Cash and cash equivalents 1,137 162
Loans and other borrowings – current (427) (126)
– non-current (1,239) (1,569)
Net debt (529) (1,533)
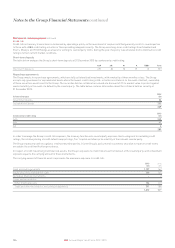
Movement in net debt
Net increase/(decrease) in cash and cash equivalents, net of overdrafts 1,107 (70)
Add back cash flows in respect of other components of net debt:
Issue of long-term bonds (458) –
Other new borrowings (400) –
New borrowings repaid 400 –
Decrease/(increase) in other borrowings 355 (382)
Close-out of currency swaps –(4)
Decrease/(increase) in net debt arising from cash flows 1,004 (456)
Non-cash movements:
Finance lease obligations (6) (3)
Increase in accrued interest (7) –
Exchange and other adjustments 13 79
Decrease/(increase) in net debt 1,004 (380)
Net debt at beginning of the year (1,533) (1,153)
Net debt at end of the year (529) (1,533)
STRATEGIC REPORT GOVERNANCE GROUP FINANCIAL STATEMENTS ADDITIONAL INFORMATIONPARENT COMPANY FINANCIAL STATEMENTS
129IHG Annual Report and Form 20-F 2015