Holiday Inn 2015 Annual Report Download - page 111
Download and view the complete annual report
Please find page 111 of the 2015 Holiday Inn annual report below. You can navigate through the pages in the report by either clicking on the pages listed below, or by using the keyword search tool below to find specific information within the annual report.-
 1
1 -
2
-
3
-
4
-
5
-
6
-
7
-
8
-
9
-
10
-
11
-
12
-
13
-
14
-
15
-
16
-
17
-
18
-
19
-
20
-
21
-
22
-
23
-
24
-
25
-
26
-
27
-
28
-
29
-
30
-
31
-
32
-
33
-
34
-
35
-
36
-
37
-
38
-
39
-
40
-
41
-
42
-
43
-
44
-
45
-
46
-
47
-
48
-
49
-
50
-
51
-
52
-
53
-
54
-
55
-
56
-
57
-
58
-
59
-
60
-
61
-
62
-
63
-
64
-
65
-
66
-
67
-
68
-
69
-
70
-
71
-
72
-
73
-
74
-
75
-
76
-
77
-
78
-
79
-
80
-
81
-
82
-
83
-
84
-
85
-
86
-
87
-
88
-
89
-
90
-
91
-
92
-
93
-
94
-
95
-
96
-
97
-
98
-
99
-
100
-
 101
101 -
 102
102 -
 103
103 -
 104
104 -
 105
105 -
 106
106 -
 107
107 -
 108
108 -
 109
109 -
 110
110 -
 111
111 -
 112
112 -
 113
113 -
 114
114 -
 115
115 -
 116
116 -
 117
117 -
 118
118 -
 119
119 -
 120
120 -
 121
121 -
122
-
123
-
124
-
125
-
126
-
127
-
128
-
129
-
130
-
131
-
132
-
133
-
134
-
135
-
136
-
137
-
138
-
139
-
140
-
141
-
142
-
143
-
144
-
145
-
146
-
147
-
148
-
149
-
150
-
151
-
152
-
153
-
154
-
155
-
156
-
157
-
158
-
159
-
160
-
161
-
162
-
163
-
164
-
165
-
166
-
167
-
168
-
169
-
170
-
171
-
172
-
173
-
174
-
175
-
176
-
177
-
178
-
179
-
180
-
181
-
182
-
183
-
184
 |
 |

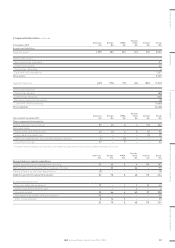
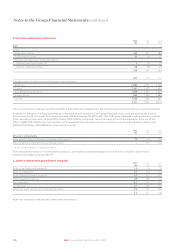
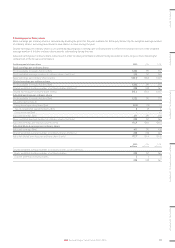
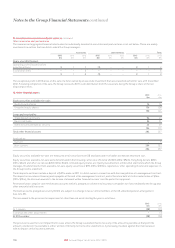
7. Tax continued
TotalaBefore exceptional itemsb
2015
%
2014
%
2013
%
2015
%
2014
%
2013
%
Reconciliation of tax charge, including gain on disposal of assets
UK corporation tax at standard rate 20.3 21.5 23.3 20.3 21.5 23.3
Non-deductible expenditure and non-taxable incomec(8.9) 4.9 16.6 1.6 1.0 1.9
Non-recoverable withholding taxes 0.1 0.4 1.2 0.3 0.4 1.2
Net effect of different rates of tax in overseas businesses 7.1 11.5 11.6 15.3 12.8 11.9
Effect of changes in tax rates and tax lawsd(1.5) 0.3 (0.1) 0.1 0.1 (0.1)
Benefit of tax reliefs on which no deferred tax previously recognised (0.1) (0.4) (15.0) (0.1) (0.3) (1.1)
Effect of adjustments to estimated recoverable deferred tax assets (0.9) 0.2 (6.4) (1.7) (0.2) (4.9)
Adjustment to tax charge in respect of prior periods (2.8) (3.7) (2.2) (5.4) (3.9) (2.1)
Deferred tax provision on unremitted earnings ––10.5 –––
Other 0.1 –(1.8) ––(0.6)
13.4 34.7 37.7 30.4 31.4 29.5
a Calculated in relation to total profits including exceptional items.
b Calculated in relation to profits excluding exceptional items.
c In 2015, total of (8.9)% represents (9.8)% in respect of accounting gains in excess of gains subject to taxation, offset by 0.9% of other items.
d In 2015, total of (1.5)% predominantly reflects the judgement that state tax law changes would now apply to the deferred gain from the 2014 disposal of InterContinental New York Barclay.
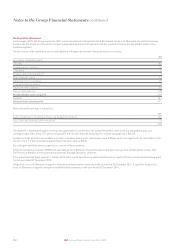
The UK statutory tax rate will reduce to 18% on 1 April 2020. The Group does not anticipate this change having a material effect.
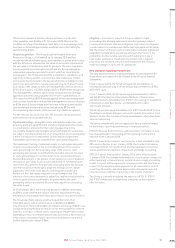
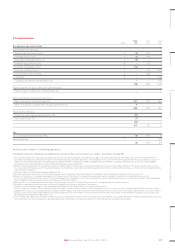
Tax paid
Total net tax paid during the year of $110m (2014: $136m, 2013: $97m) comprises $109m (2014: $136m, 2013: $92m) paid in respect of operating
activities and $1m (2014: $nil, 2013: $5m) paid in respect of investing activities.
Tax paid represents an effective rate of 8% (2014: 23%, 2013: 16%) on total profits and is lower than the effective income statement tax rate
of 30% (2014: 31%, 2013: 29%) primarily due to the impact of exceptional accounting gains taxable on a deferred basis, without which the
equivalent effective rate would be 20%. The remaining difference is primarily due to deferred taxes (including the realisation of assets such as tax
losses), the receipt of refunds in respect of prior years and provisions for tax for which no payment of tax has currently been made.
Corporation tax liabilities did not arise in 2015 in the UK and are not expected to arise for a number of years thereafter due to expenses and
associated tax losses attributable principally to employment matters, inparticular additional shortfall contributions made to the UK pension plan
in the years 2007 to 2013.
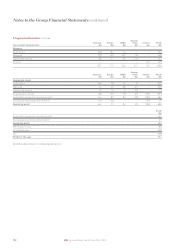
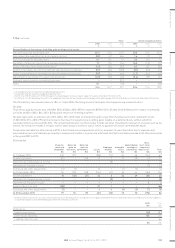
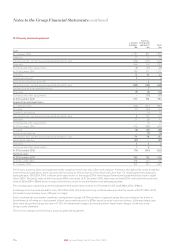
Deferred tax
Property,
plant and
equipment
$m
Deferred
gains on
loan notes
$m
Deferred
gains on
investments
$m
Losses
$m
Employee
benefits
$m
Intangible
assets
$m
Undistributed
earnings of
subsidiaries
$m
Other
short-term
temporary
differencesa
$m
Total
$m
At 1 January 2014 240 107 – (186) (37) 34 66 (157) 67
Income statement (55) – 108 17 3 22 (19) (3) 73
Statement of comprehensive income ––––(8)– –1(7)
Statement of changes in equity –––––– –(3)(3)
Exchange and other adjustments (11) (2) – 15 1 (4) (3) – (4)
At 31 December 2014 174 105 108 (154) (41) 52 44 (162) 126
Income statement 18 (50) (21) 62 6 22 29 (36) 30
Statement of comprehensive income ––––(2)– ––(2)
Statement of changes in equity –––––– –33
Assets of business sold (88)––211– ––(66)
Exchange and other adjustments (5)––44(4)(3)(1)(5)
At 31 December 2015 99 55 87 (67) (32) 70 70 (196) 86
a Primarily relates to provisions, accruals, amortisation and share-based payments. Includes an asset of approximately $70m which is expected to be reclassified to current taxes subject to
a requested change of tax treatment being approved by the relevant tax authority.
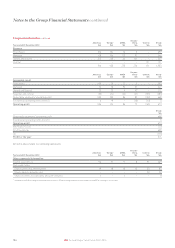
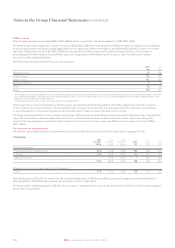
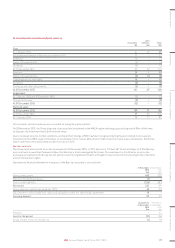
2015
$m
2014
$m
Analysed as:
Deferred tax assets (49) (87)
Deferred tax liabilities 135 147
Liabilities held for sale –66
86 126
STRATEGIC REPORT GOVERNANCE GROUP FINANCIAL STATEMENTS ADDITIONAL INFORMATIONPARENT COMPANY FINANCIAL STATEMENTS
109IHG Annual Report and Form 20-F 2015