Holiday Inn 2015 Annual Report Download - page 103
Download and view the complete annual report
Please find page 103 of the 2015 Holiday Inn annual report below. You can navigate through the pages in the report by either clicking on the pages listed below, or by using the keyword search tool below to find specific information within the annual report.-
 1
1 -
2
-
3
-
4
-
5
-
6
-
7
-
8
-
9
-
10
-
11
-
12
-
13
-
14
-
15
-
16
-
17
-
18
-
19
-
20
-
21
-
22
-
23
-
24
-
25
-
26
-
27
-
28
-
29
-
30
-
31
-
32
-
33
-
34
-
35
-
36
-
37
-
38
-
39
-
40
-
41
-
42
-
43
-
44
-
45
-
46
-
47
-
48
-
49
-
50
-
51
-
52
-
53
-
54
-
55
-
56
-
57
-
58
-
59
-
60
-
61
-
62
-
63
-
64
-
65
-
66
-
67
-
68
-
69
-
70
-
71
-
72
-
73
-
74
-
75
-
76
-
77
-
78
-
79
-
80
-
81
-
82
-
83
-
84
-
85
-
86
-
87
-
88
-
89
-
90
-
91
-
92
-
 93
93 -
 94
94 -
 95
95 -
 96
96 -
 97
97 -
 98
98 -
 99
99 -
 100
100 -
 101
101 -
 102
102 -
 103
103 -
 104
104 -
 105
105 -
 106
106 -
 107
107 -
 108
108 -
 109
109 -
 110
110 -
 111
111 -
 112
112 -
 113
113 -
114
-
115
-
116
-
117
-
118
-
119
-
120
-
121
-
122
-
123
-
124
-
125
-
126
-
127
-
128
-
129
-
130
-
131
-
132
-
133
-
134
-
135
-
136
-
137
-
138
-
139
-
140
-
141
-
142
-
143
-
144
-
145
-
146
-
147
-
148
-
149
-
150
-
151
-
152
-
153
-
154
-
155
-
156
-
157
-
158
-
159
-
160
-
161
-
162
-
163
-
164
-
165
-
166
-
167
-
168
-
169
-
170
-
171
-
172
-
173
-
174
-
175
-
176
-
177
-
178
-
179
-
180
-
181
-
182
-
183
-
184
 |
 |
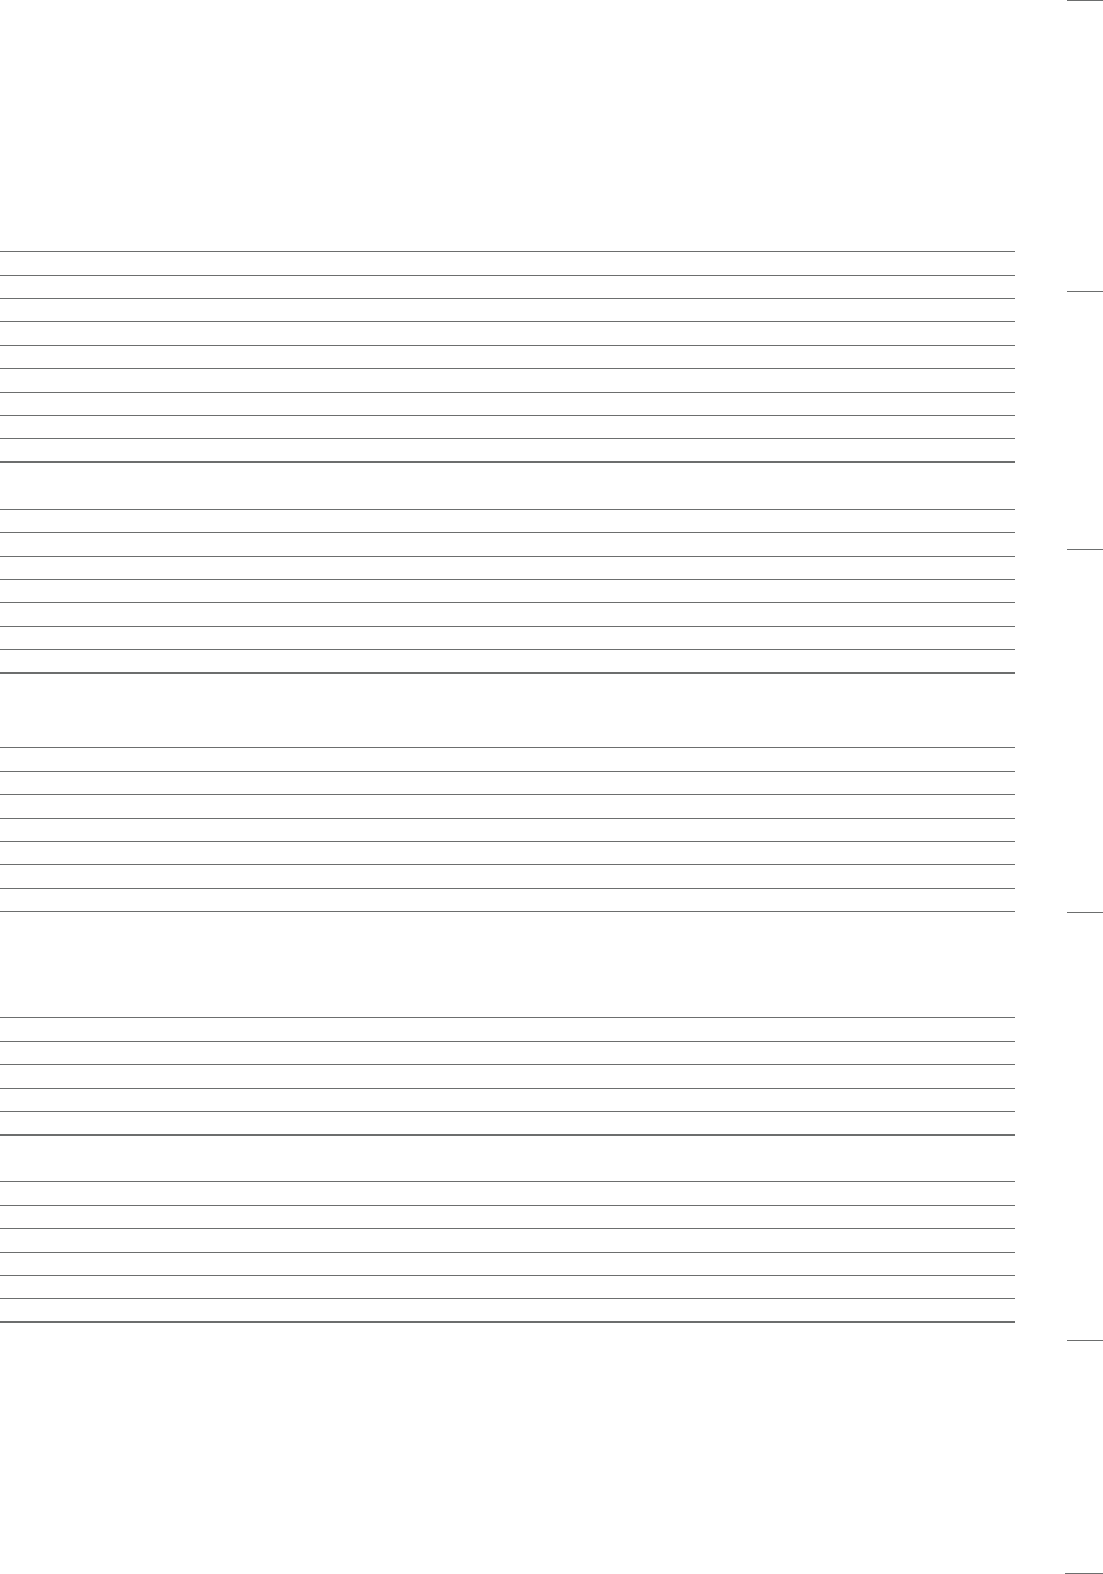
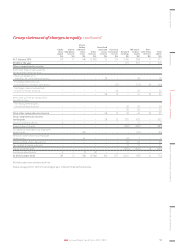
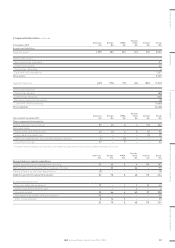
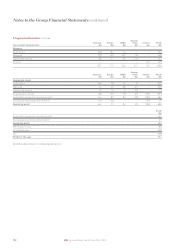
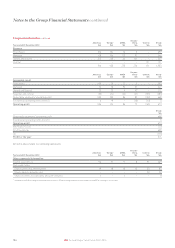
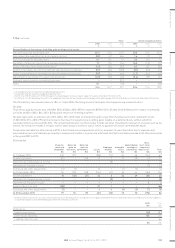
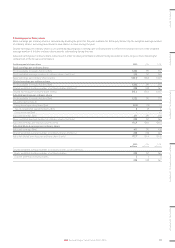
2. Segmental information continued
31 December 2015
Americas
$m
Europe
$m
AMEA
$m
Greater
China
$m
Central
$m
Group
$m
Assets and liabilities
Segment assets 1,355 383 260 148 396 2,542
Unallocated assets:
Non-current tax receivable 37
Deferred tax assets 49
Current tax receivable 4
Cash and cash equivalents 1,137
Total assets 3,769
Segment liabilities (449) (156) (76) (46) (834) (1,561)
Unallocated liabilities:
Current tax payable (85)
Deferred tax liabilities (135)
Derivative financial instruments (3)
Loans and other borrowings (1,666)
Total liabilities (3,450)
Year ended 31 December 2015
Americas
$m
Europe
$m
AMEA
$m
Greater
China
$m
Central
$m
Group
$m
Other segmental information
Capital expenditure (see below) 87 45 8 4 118 262
Non-cash items:
Depreciation and amortisationa23 10 6 8 49 96
Share-based payments cost ––––1919
Share of losses/(profits) of associates and joint ventures 5–(2)––3
Impairment charges 27–9––36
a Included in the $96m of depreciation and amortisation is $50m relating to administrative expenses and $46m relating to cost of sales.
Americas
$m
Europe
$m
AMEA
$m
Greater
China
$m
Central
$m
Group
$m
Reconciliation of capital expenditure
Capital expenditure per management reporting 87 45 8 4 118 262
Management contracts acquired on disposal of hotels –33 –64 –97
Timing differences and other adjustments (5)––––(5)
Additions per the Financial Statements 82 78 8 68 118 354
Comprising additions to:
Property, plant and equipment 19–112142
Assets classified as held for sale –––2–2
Intangible assets 25 64 4 65 97 255
Investment in associates and joint ventures 30––––30
Other financial assets 8143––25
82 78 8 68 118 354
STRATEGIC REPORT GOVERNANCE GROUP FINANCIAL STATEMENTS ADDITIONAL INFORMATIONPARENT COMPANY FINANCIAL STATEMENTS
101IHG Annual Report and Form 20-F 2015