Holiday Inn 2015 Annual Report Download - page 108
Download and view the complete annual report
Please find page 108 of the 2015 Holiday Inn annual report below. You can navigate through the pages in the report by either clicking on the pages listed below, or by using the keyword search tool below to find specific information within the annual report.-
 1
1 -
2
-
3
-
4
-
5
-
6
-
7
-
8
-
9
-
10
-
11
-
12
-
13
-
14
-
15
-
16
-
17
-
18
-
19
-
20
-
21
-
22
-
23
-
24
-
25
-
26
-
27
-
28
-
29
-
30
-
31
-
32
-
33
-
34
-
35
-
36
-
37
-
38
-
39
-
40
-
41
-
42
-
43
-
44
-
45
-
46
-
47
-
48
-
49
-
50
-
51
-
52
-
53
-
54
-
55
-
56
-
57
-
58
-
59
-
60
-
61
-
62
-
63
-
64
-
65
-
66
-
67
-
68
-
69
-
70
-
71
-
72
-
73
-
74
-
75
-
76
-
77
-
78
-
79
-
80
-
81
-
82
-
83
-
84
-
85
-
86
-
87
-
88
-
89
-
90
-
91
-
92
-
93
-
94
-
95
-
96
-
97
-
 98
98 -
 99
99 -
 100
100 -
 101
101 -
 102
102 -
 103
103 -
 104
104 -
 105
105 -
 106
106 -
 107
107 -
 108
108 -
 109
109 -
 110
110 -
 111
111 -
 112
112 -
 113
113 -
 114
114 -
 115
115 -
 116
116 -
 117
117 -
 118
118 -
119
-
120
-
121
-
122
-
123
-
124
-
125
-
126
-
127
-
128
-
129
-
130
-
131
-
132
-
133
-
134
-
135
-
136
-
137
-
138
-
139
-
140
-
141
-
142
-
143
-
144
-
145
-
146
-
147
-
148
-
149
-
150
-
151
-
152
-
153
-
154
-
155
-
156
-
157
-
158
-
159
-
160
-
161
-
162
-
163
-
164
-
165
-
166
-
167
-
168
-
169
-
170
-
171
-
172
-
173
-
174
-
175
-
176
-
177
-
178
-
179
-
180
-
181
-
182
-
183
-
184
 |
 |

Notes to the Group Financial Statements continued
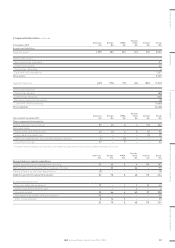
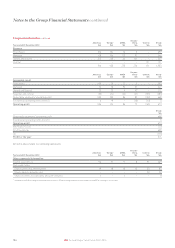
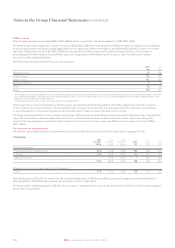
3. Staff costs and Directors’ emoluments
2015
$m
2014
$m
2013
$m
Staff
Costs:
Wages and salaries 562 577 580
Social security costs 33 42 41
Pension and other post-retirement benefits:
Defined benefit plans (note 25) 510 10
Defined contribution plans 28 28 25
628 657 656
2015 2014 2013
Average number of employees, including part-time employees:
Americas 2,082 2,191 2,548
Europe 1,041 1,557 1,602
Asia, Middle East and Africa 1,658 1,451 1,545
Greater China 865 1,092 1,083
Central 1,665 1,506 1,401
7,311 7,797 8,179
The costs of the above employees are borne by IHG. Of these, 90% were employed on a full-time basis and 10% were employed on a part-time basis.
In addition to the above, the Group has employees who work directly on behalf of the System Fund and whose costs are borne by the Fund as
disclosed in note 32. In line with IHG’s business model, IHG also employs 706 (2014: 602, 2013: 578) General Managers who work in the managed
hotels and whose total costs of $154m (2014: $142m, 2013: $135m) are borne by those hotels and, in the US predominantly, there are 19,746
(2014: 11,848, 2013: 10,834) other hotel workers in the managed hotels who have contracts or letters of service with IHG whose total costs of
$782m (2014: $449m, 2013: $383m) are borne by those hotels.
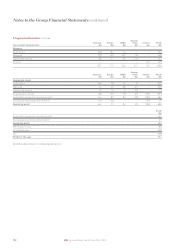
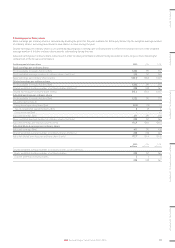
2015
$m
2014
$m
2013
$m
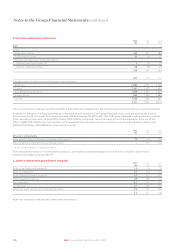
Directors’ emoluments
Base salaries, fees, performance payments and benefitsa7.9 9.0 8.5
Pension benefits under defined contribution plans –0.2 0.4
a In 2014, excludes ICETUS cash-out payment of £9.4m.
More detailed information on the emoluments, pensions, share awards and shareholdings for each Director is shown in the Directors’
Remuneration Report on pages 68 to 77.
4. Auditor’s remuneration paid to Ernst & Young LLP
2015
$m
2014
$m
2013
$m
Audit of the Financial Statements 2.5 2.4 2.0
Audit of subsidiaries 2.1 2.0 1.4
Audit-related assurance services 0.2 0.2 0.5
Other assurance services 0.9 0.9 1.2
Tax compliance 0.2 0.2 0.2
Tax advisor y 0.1 0.3 0.4
Other non-audit services not covered by the above 0.4 0.1 0.1
6.4 6.1 5.8
Audit fees in respect of the pension scheme were not material.
106 IHG Annual Report and Form 20-F 2015