Holiday Inn 2015 Annual Report Download - page 51
Download and view the complete annual report
Please find page 51 of the 2015 Holiday Inn annual report below. You can navigate through the pages in the report by either clicking on the pages listed below, or by using the keyword search tool below to find specific information within the annual report.-
 1
1 -
2
-
3
-
4
-
5
-
6
-
7
-
8
-
9
-
10
-
11
-
12
-
13
-
14
-
15
-
16
-
17
-
18
-
19
-
20
-
21
-
22
-
23
-
24
-
25
-
26
-
27
-
28
-
29
-
30
-
31
-
32
-
33
-
34
-
35
-
36
-
37
-
38
-
39
-
40
-
 41
41 -
 42
42 -
 43
43 -
 44
44 -
 45
45 -
 46
46 -
 47
47 -
 48
48 -
 49
49 -
 50
50 -
 51
51 -
 52
52 -
 53
53 -
 54
54 -
 55
55 -
 56
56 -
 57
57 -
 58
58 -
 59
59 -
 60
60 -
 61
61 -
62
-
63
-
64
-
65
-
66
-
67
-
68
-
69
-
70
-
71
-
72
-
73
-
74
-
75
-
76
-
77
-
78
-
79
-
80
-
81
-
82
-
83
-
84
-
85
-
86
-
87
-
88
-
89
-
90
-
91
-
92
-
93
-
94
-
95
-
96
-
97
-
98
-
99
-
100
-
101
-
102
-
103
-
104
-
105
-
106
-
107
-
108
-
109
-
110
-
111
-
112
-
113
-
114
-
115
-
116
-
117
-
118
-
119
-
120
-
121
-
122
-
123
-
124
-
125
-
126
-
127
-
128
-
129
-
130
-
131
-
132
-
133
-
134
-
135
-
136
-
137
-
138
-
139
-
140
-
141
-
142
-
143
-
144
-
145
-
146
-
147
-
148
-
149
-
150
-
151
-
152
-
153
-
154
-
155
-
156
-
157
-
158
-
159
-
160
-
161
-
162
-
163
-
164
-
165
-
166
-
167
-
168
-
169
-
170
-
171
-
172
-
173
-
174
-
175
-
176
-
177
-
178
-
179
-
180
-
181
-
182
-
183
-
184
 |
 |

Borrowings included bank overdrafts of $39m (2014: $107m), which
were matched by an equivalent amount of cash and cash equivalents
under the Group’s cash pooling arrangements. Under these
arrangements, each pool contains a number of bank accounts with the
same financial institution, and the Group pays interest on net overdraft
balances within each pool. The cash pools are used for day-to-day cash
management purposes and are managed daily as closely as possible
to a zero balance on a net basis for each pool. Overseas subsidiaries are
typically in a cash-positive position, with the most significant balances
in the US, Canada, and Singapore, and the matching overdrafts are held
by the Group’s central treasury company in the UK.
Cash and cash equivalents include $1m (2014: $4m) that is not
available for use by the Group due to local exchange controls.
Information on the maturity profile and interest structure
of borrowings is included in notes 20 and 21 to the Group
Financial Statements.
The Group had net assets of $319m at 31 December 2015, (net
liabilities of $717m at 31 December 2014), with the increase primarily
as a result of the profit on disposal of InterContinental Hong Kong. At
the end of 2015, the Group was trading significantly within its banking
covenants and facilities.
Cash from operating activities
Net cash from operating activities totalled $628m for the year
ended 31 December 2015, up $85m on the previous year (largely
due to reduced cash flows relating to exceptional operating items).
Cash flow from operating activities is the principal source of cash
used to fund the ongoing operating expenses, interest payments,
maintenance capital expenditure and normal dividend payments of
the Group. The Group believes that the requirements of its existing
business and future investment can be met from cash generated
internally, disposition of assets, and external finance expected to
be available to it.
Cash from investing activities
Net cash inflows from investing activities totalled $589m, an increase of
$466m over 2014. $1,314m of disposal proceeds primarily related to the
disposal of InterContinental Paris – Le Grand and InterContinental Hong
Kong. Investing expenditure includes $438m, net of working capital
adjustments and cash acquired, on the acquisition of Kimpton Hotels
& Restaurants. Capital expenditure on property, plant and equipment
decreased from $84m in 2014 to $42m, as the prior year included
capital expenditure on InterContinental Paris – Le Grand and on the
first two hotels under conversion to the Group’s EVEN Hotels brand.
The Group had committed contractual capital expenditure of $76m
at 31 December 2015 (2014: $117m).
Cash used in financing activities
Net cash used in financing activities totalled $110m, which was
$626m lower than 2014, mainly due to $763m special dividends paid
and $110m shares repurchased in 2014. Net inflows from borrowings
were $279m lower than in 2014.
Overall net debt reduced during the year by $1,004m to $529m as
at 31 December 2015.
Off-balance sheet arrangements
At 31 December 2015, the Group had no off-balance sheet
arrangements that have or are reasonably likely to have a current
or future material effect on the Group’s financial condition, revenues
or expenses, results of operations, liquidity, capital expenditures or
capital resources.
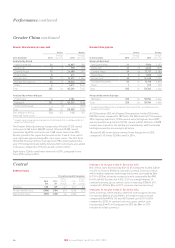
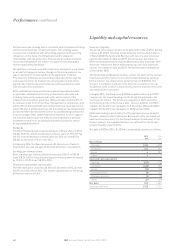
Contractual obligations
The Group had the following contractual obligations outstanding
as of 31 December 2015.
$m
Total
amounts
committed
Less
than
1 year
1-3
years
3-5
years
After 5
years
Long-term debt
obligationsa, b
1,407 370 – – 1,037
Interest payableb343 62 79 79 123
Derivatives 33–––
Finance lease
obligationsc
3,350 17 33 32 3,268
Operating lease
obligations
608 47 84 75 402
Agreed pension
scheme
contributionsd
99–––
Capital contracts
placed
76 76 – – –
Total 5,796 584 196 186 4,830
a Repayment period classified according to the related facility maturity date.
b Excluding bank overdrafts.
c Mainly represents the minimum lease payments related to the 99-year lease
(of which 90 years remain) on InterContinental Boston. Payments under the lease step up
at regular intervals over the lease term.
d Largely relates to US pension obligations.
Contingent liabilities
Contingent liabilities include performance guarantees with possible
cash outflows totalling $13m, guarantees over the debt of equity
investments of $30m, outstanding letters of credit of $37m, and
an indemnity over a $43m bank loan made to an associate. See
note 30 to the Group Financial Statements for further details.
49
IHG Annual Report and Form 20-F 2015
STRATEGIC REPORT GOVERNANCE GROUP FINANCIAL STATEMENTS ADDITIONAL INFORMATIONPARENT COMPANY FINANCIAL STATEMENTS