Holiday Inn 2015 Annual Report Download - page 37
Download and view the complete annual report
Please find page 37 of the 2015 Holiday Inn annual report below. You can navigate through the pages in the report by either clicking on the pages listed below, or by using the keyword search tool below to find specific information within the annual report.-
 1
1 -
2
-
3
-
4
-
5
-
6
-
7
-
8
-
9
-
10
-
11
-
12
-
13
-
14
-
15
-
16
-
17
-
18
-
19
-
20
-
21
-
22
-
23
-
24
-
25
-
26
-
 27
27 -
 28
28 -
 29
29 -
 30
30 -
 31
31 -
 32
32 -
 33
33 -
 34
34 -
 35
35 -
 36
36 -
 37
37 -
 38
38 -
 39
39 -
 40
40 -
 41
41 -
 42
42 -
 43
43 -
 44
44 -
 45
45 -
 46
46 -
 47
47 -
48
-
49
-
50
-
51
-
52
-
53
-
54
-
55
-
56
-
57
-
58
-
59
-
60
-
61
-
62
-
63
-
64
-
65
-
66
-
67
-
68
-
69
-
70
-
71
-
72
-
73
-
74
-
75
-
76
-
77
-
78
-
79
-
80
-
81
-
82
-
83
-
84
-
85
-
86
-
87
-
88
-
89
-
90
-
91
-
92
-
93
-
94
-
95
-
96
-
97
-
98
-
99
-
100
-
101
-
102
-
103
-
104
-
105
-
106
-
107
-
108
-
109
-
110
-
111
-
112
-
113
-
114
-
115
-
116
-
117
-
118
-
119
-
120
-
121
-
122
-
123
-
124
-
125
-
126
-
127
-
128
-
129
-
130
-
131
-
132
-
133
-
134
-
135
-
136
-
137
-
138
-
139
-
140
-
141
-
142
-
143
-
144
-
145
-
146
-
147
-
148
-
149
-
150
-
151
-
152
-
153
-
154
-
155
-
156
-
157
-
158
-
159
-
160
-
161
-
162
-
163
-
164
-
165
-
166
-
167
-
168
-
169
-
170
-
171
-
172
-
173
-
174
-
175
-
176
-
177
-
178
-
179
-
180
-
181
-
182
-
183
-
184
 |
 |

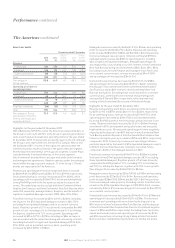
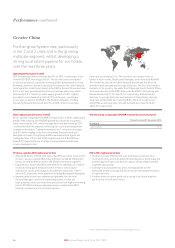
IHG’s regional performance in 2015
IHG’s comparable RevPAR in The Americas increased 4.6%, driven
by 3.8% average daily rate growth. The region is predominantly
represented by the US, where comparable RevPAR increased 4.7%.
RevPAR in our upper midscale brands in the US increased slightly
behind the segment, with RevPAR for the Holiday Inn brand increasing
5.0% whilst that for the Holiday Inn Express brand increased by 4.3%,
however our absolute occupancy was higher than the industry.
Our US upscale brands (Crowne Plaza and Hotel Indigo) performed
ahead of the upscale segment, increasing RevPAR by 6.6% and 7.5%
respectively. Our US upper upscale brand, Kimpton, saw RevPAR
increase by 4.1%. In Canada, our RevPAR increased by 0.9%, and
Mexico increased by 10.1%, both behind industry growth.
Strong demand for IHG-branded hotels continued, with 37,655
rooms signed, and the pipeline increasing by 10,189 rooms during
2015. We continued to demonstrate our commitment to quality, with
14,709 rooms leaving the IHG System.
IHG’s 2016 regional priorities
1. Grow quality System size through driving signings, working
with owners to accelerate openings, assisting hotels to improve
their performance, and continuing to support hotel performance.
2. Increase brand quality and differentiation with a focus on installing
new room designs across Holiday Inn and Crowne Plaza (see page
20), implementing a full hotel design for Holiday Inn Express and
continuing to increase the quality and delivery of food and beverage
offerings.
3. Deliver superior revenue contribution through an improved
owner-centric hotel support model and sales and revenue
management capabilities.
Americas comparable RevPAR movement onprevious year
12 months ended 31 December 2015
Franchised Managed
Crowne Plaza 6.7% InterContinental 2.4%
Kimpton 4.1%
Holiday Inn 4.6% Crowne Plaza 9.6%
Holiday Inn
Express
4.1% Holiday Inn 5.7%
All brands 4.6% Staybridge Suites 4.2%
Candlewood Suites 6.7%
All brands 4.7%
Owned and leased
All brands 6.7%
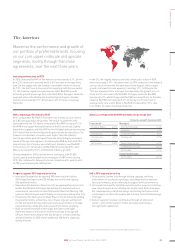
The Americas
Maximise the performance and growth of
our portfolio of preferred brands, focusing
on our core upper midscale and upscale
segments, mostly through franchise
agreements, over the next three years.
Industry performance in 2015
In 2015, industry RevPAR in The Americas increased by 6.7%, driven
by a 2.3% increase in demand and a 5.5% increase in average daily
rate. On the supply side, the number of available rooms increased
by 1.3%, the first time in five years that supply growth has exceeded
1%. All industry segments experienced robust RevPAR growth
driven by growth in average daily rate. RevPAR in the upper midscale
segment, where the Holiday Inn and Holiday Inn Express brands
operate, increased by 5.5%, driven by a 4.0% increase in average
daily rate.
Progress against 2015 regional priorities
• Increased System size by opening 183 new hotels (including
93 Holiday Inn Express and 33 Holiday Inn hotels) and signing
325 additional hotels.
• Expanded distribution in New York City by opening three key hotels
(under the EVEN, Hotel Indigo and Holiday Inn brands) and also
commenced renovation of InterContinental New York Barclay. IHG
now has 34 hotels open and 15 hotels in its pipeline in New York City.
• Progressed the multi-year Crowne Plaza transformation by adding
five pipeline hotels, achieving a record level of guest satisfaction
for the brand and driving improved revenue performance through
new marketing campaigns and focused hotel action-planning.
• Built strong momentum with Holiday Inn Express through
implementation of the brand’s new hotel design (see page 20).
59 open hotels have adopted the full design or incorporated key
design elements in 2015 and an additional 318 hotels signed up
during the year.
In the US, the lodging industry demand continued to outpace GDP,
which increased 2.4% – the same level as 2014. Industry room demand
set records in all months this year apart from August, while supply
growth continued to move upwards, reaching 1.1%, (still below the
1.9% per annum historic average). Average daily rate growth of 4.4%
drove a 6.3% increase in US RevPAR. US upper midscale RevPAR
increased 6.3%, while US upscale RevPAR increased 5.6%. In Canada,
industry RevPAR increased by 3.4%, driven by a 4.2% increase in
average daily rate, and in Mexico, RevPAR increased by 19.1%, due
to an 18.6% increase in average daily rate.
Source: Smith Travel Research for all of the above industry facts.
35
IHG Annual Report and Form 20-F 2015
STRATEGIC REPORT GOVERNANCE GROUP FINANCIAL STATEMENTS ADDITIONAL INFORMATIONPARENT COMPANY FINANCIAL STATEMENTS