Holiday Inn 2015 Annual Report Download - page 104
Download and view the complete annual report
Please find page 104 of the 2015 Holiday Inn annual report below. You can navigate through the pages in the report by either clicking on the pages listed below, or by using the keyword search tool below to find specific information within the annual report.-
 1
1 -
2
-
3
-
4
-
5
-
6
-
7
-
8
-
9
-
10
-
11
-
12
-
13
-
14
-
15
-
16
-
17
-
18
-
19
-
20
-
21
-
22
-
23
-
24
-
25
-
26
-
27
-
28
-
29
-
30
-
31
-
32
-
33
-
34
-
35
-
36
-
37
-
38
-
39
-
40
-
41
-
42
-
43
-
44
-
45
-
46
-
47
-
48
-
49
-
50
-
51
-
52
-
53
-
54
-
55
-
56
-
57
-
58
-
59
-
60
-
61
-
62
-
63
-
64
-
65
-
66
-
67
-
68
-
69
-
70
-
71
-
72
-
73
-
74
-
75
-
76
-
77
-
78
-
79
-
80
-
81
-
82
-
83
-
84
-
85
-
86
-
87
-
88
-
89
-
90
-
91
-
92
-
93
-
 94
94 -
 95
95 -
 96
96 -
 97
97 -
 98
98 -
 99
99 -
 100
100 -
 101
101 -
 102
102 -
 103
103 -
 104
104 -
 105
105 -
 106
106 -
 107
107 -
 108
108 -
 109
109 -
 110
110 -
 111
111 -
 112
112 -
 113
113 -
 114
114 -
115
-
116
-
117
-
118
-
119
-
120
-
121
-
122
-
123
-
124
-
125
-
126
-
127
-
128
-
129
-
130
-
131
-
132
-
133
-
134
-
135
-
136
-
137
-
138
-
139
-
140
-
141
-
142
-
143
-
144
-
145
-
146
-
147
-
148
-
149
-
150
-
151
-
152
-
153
-
154
-
155
-
156
-
157
-
158
-
159
-
160
-
161
-
162
-
163
-
164
-
165
-
166
-
167
-
168
-
169
-
170
-
171
-
172
-
173
-
174
-
175
-
176
-
177
-
178
-
179
-
180
-
181
-
182
-
183
-
184
 |
 |

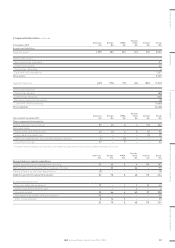
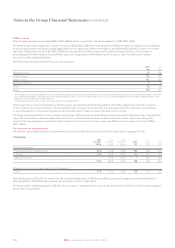
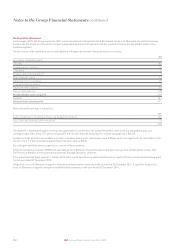
Notes to the Group Financial Statements continued
2. Segmental information continued
Year ended 31 December 2014
Americas
$m
Europe
$m
AMEA
$m
Greater
China
$m
Central
$m
Group
$m
Revenue
Franchised 630 104 16 4 – 754
Managed 103 159 187 99 – 548
Owned and leased 138 111 39 139 – 427
Central ––––129129
871 374 242 242 129 1,858
Americas
$m
Europe
$m
AMEA
$m
Greater
China
$m
Central
$m
Group
$m
Segmental result
Franchised 544 78 12 5 – 639
Managed 47 30 88 63 – 228
Owned and leased 18 14 3 42 – 77
Regional and central (65) (33) (19) (21) (155) (293)
Reportable segments’ operating profit 544 89 84 89 (155) 651
Exceptional operating items (note 5) 110 (56) – – (25) 29
Operating profit 654 33 84 89 (180) 680
Group
$m
Reportable segments’ operating profit 651
Exceptional operating items (note 5) 29
Operating profit 680
Net finance costs (80)
Profit before tax 600
Tax (208)
Profit for the year 392
All items above relate to continuing operations.
102 IHG Annual Report and Form 20-F 2015