Holiday Inn 2015 Annual Report Download - page 106
Download and view the complete annual report
Please find page 106 of the 2015 Holiday Inn annual report below. You can navigate through the pages in the report by either clicking on the pages listed below, or by using the keyword search tool below to find specific information within the annual report.-
 1
1 -
2
-
3
-
4
-
5
-
6
-
7
-
8
-
9
-
10
-
11
-
12
-
13
-
14
-
15
-
16
-
17
-
18
-
19
-
20
-
21
-
22
-
23
-
24
-
25
-
26
-
27
-
28
-
29
-
30
-
31
-
32
-
33
-
34
-
35
-
36
-
37
-
38
-
39
-
40
-
41
-
42
-
43
-
44
-
45
-
46
-
47
-
48
-
49
-
50
-
51
-
52
-
53
-
54
-
55
-
56
-
57
-
58
-
59
-
60
-
61
-
62
-
63
-
64
-
65
-
66
-
67
-
68
-
69
-
70
-
71
-
72
-
73
-
74
-
75
-
76
-
77
-
78
-
79
-
80
-
81
-
82
-
83
-
84
-
85
-
86
-
87
-
88
-
89
-
90
-
91
-
92
-
93
-
94
-
95
-
 96
96 -
 97
97 -
 98
98 -
 99
99 -
 100
100 -
 101
101 -
 102
102 -
 103
103 -
 104
104 -
 105
105 -
 106
106 -
 107
107 -
 108
108 -
 109
109 -
 110
110 -
 111
111 -
 112
112 -
 113
113 -
 114
114 -
 115
115 -
 116
116 -
117
-
118
-
119
-
120
-
121
-
122
-
123
-
124
-
125
-
126
-
127
-
128
-
129
-
130
-
131
-
132
-
133
-
134
-
135
-
136
-
137
-
138
-
139
-
140
-
141
-
142
-
143
-
144
-
145
-
146
-
147
-
148
-
149
-
150
-
151
-
152
-
153
-
154
-
155
-
156
-
157
-
158
-
159
-
160
-
161
-
162
-
163
-
164
-
165
-
166
-
167
-
168
-
169
-
170
-
171
-
172
-
173
-
174
-
175
-
176
-
177
-
178
-
179
-
180
-
181
-
182
-
183
-
184
 |
 |

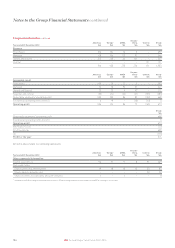
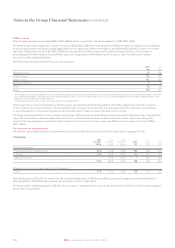
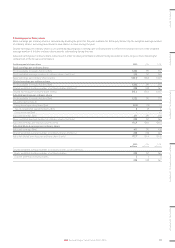
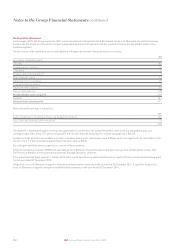
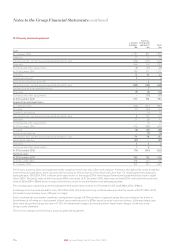
Notes to the Group Financial Statements continued
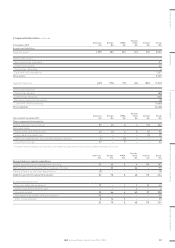
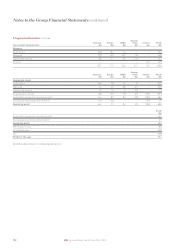
2. Segmental information continued
Year ended 31 December 2013
Americas
$m
Europe
$m
AMEA
$m
Greater
China
$m
Central
$m
Group
$m
Revenue
Franchised 576 104 16 3 – 699
Managed 128 156 170 92 – 546
Owned and leased 212 140 44 141 – 537
Central ––––121121
916 400 230 236 121 1,903
Americas
$m
Europe
$m
AMEA
$m
Greater
China
$m
Central
$m
Group
$m
Segmental result
Franchised 499 79 12 5 – 595
Managed 74 30 92 51 – 247
Owned and leased 30 30 4 47 – 111
Regional and central (53) (34) (22) (21) (155) (285)
Reportable segments’ operating profit 550 105 86 82 (155) 668
Exceptional operating items (note 5) 6 19 – (10) (10) 5
Operating profit 556 124 86 72 (165) 673
Group
$m
Reportable segments’ operating profit 668
Exceptional operating items (note 5) 5
Operating profit 673
Net finance costs (73)
Profit before tax 600
Tax (226)
Profit for the year 374
All items above relate to continuing operations.
Year ended 31 December 2013
Americas
$m
Europe
$m
AMEA
$m
Greater
China
$m
Central
$m
Group
$m
Other segmental information
Capital expenditure 116 37 17 8 91 269
Non-cash items:
Depreciation and amortisationa19 18 10 15 23 85
Share-based payments cost ––––2222
Share of profits of associates and joint ventures 5–3––8
a Included in the $85m of depreciation and amortisation is $34m relating to administrative expenses and $51m relating to cost of sales.
104 IHG Annual Report and Form 20-F 2015