Holiday Inn 2015 Annual Report Download - page 34
Download and view the complete annual report
Please find page 34 of the 2015 Holiday Inn annual report below. You can navigate through the pages in the report by either clicking on the pages listed below, or by using the keyword search tool below to find specific information within the annual report.-
 1
1 -
2
-
3
-
4
-
5
-
6
-
7
-
8
-
9
-
10
-
11
-
12
-
13
-
14
-
15
-
16
-
17
-
18
-
19
-
20
-
21
-
22
-
23
-
 24
24 -
 25
25 -
 26
26 -
 27
27 -
 28
28 -
 29
29 -
 30
30 -
 31
31 -
 32
32 -
 33
33 -
 34
34 -
 35
35 -
 36
36 -
 37
37 -
 38
38 -
 39
39 -
 40
40 -
 41
41 -
 42
42 -
 43
43 -
 44
44 -
45
-
46
-
47
-
48
-
49
-
50
-
51
-
52
-
53
-
54
-
55
-
56
-
57
-
58
-
59
-
60
-
61
-
62
-
63
-
64
-
65
-
66
-
67
-
68
-
69
-
70
-
71
-
72
-
73
-
74
-
75
-
76
-
77
-
78
-
79
-
80
-
81
-
82
-
83
-
84
-
85
-
86
-
87
-
88
-
89
-
90
-
91
-
92
-
93
-
94
-
95
-
96
-
97
-
98
-
99
-
100
-
101
-
102
-
103
-
104
-
105
-
106
-
107
-
108
-
109
-
110
-
111
-
112
-
113
-
114
-
115
-
116
-
117
-
118
-
119
-
120
-
121
-
122
-
123
-
124
-
125
-
126
-
127
-
128
-
129
-
130
-
131
-
132
-
133
-
134
-
135
-
136
-
137
-
138
-
139
-
140
-
141
-
142
-
143
-
144
-
145
-
146
-
147
-
148
-
149
-
150
-
151
-
152
-
153
-
154
-
155
-
156
-
157
-
158
-
159
-
160
-
161
-
162
-
163
-
164
-
165
-
166
-
167
-
168
-
169
-
170
-
171
-
172
-
173
-
174
-
175
-
176
-
177
-
178
-
179
-
180
-
181
-
182
-
183
-
184
 |
 |

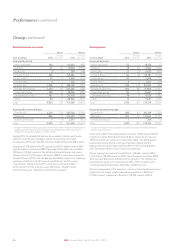
Group
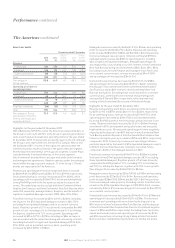
Group results
12 months ended 31 December
2015
$m
2014
$m
2015 vs
2014 %
change
2013
$m
2014 vs
2013 %
change
Revenue
Americas 955 871 9.6 916 (4.9)
Europe 265 374 (29.1) 400 (6.5)
AMEA 241 242 (0.4) 230 5.2
Greater China 207 242 (14.5) 236 2.5
Central 135 129 4.7 121 6.6
Total 1,803 1,858 (3.0) 1,903 (2.4)
Operating profit
Americas 597 544 9.7 550 (1.1)
Europe 78 89 (12.4) 105 (15.2)
AMEA 86 84 2.4 86 (2.3)
Greater China 70 89 (21.3) 82 8.5
Central (151) (155) 2.6 (155) –
Operating profit before
exceptional items
680 651 4.5 668 (2.5)
Exceptional operating
items
819 29 –5480.0
1,499 680 120.4 673 1.0
Net financial expenses (87) (80) (8.8) (73) (9.6)
Profit before tax 1,412 600 135.3 600 –
Earnings per
ordinaryshare
Basic 520.0¢ 158.3¢ 228.5 140.9¢ 12.3
Adjusted 174.9¢ 158.3¢ 10.5 158.3¢ –
Average US dollar to
sterling exchange rate
$1:
£0.65
$1:
£0.61
6.6 $1:
£0.64
(4.7)
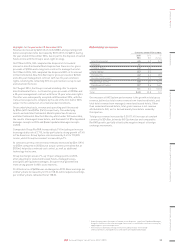
Highlights for the year ended 31 December 2015
During the year ended 31 December 2015, revenue decreased by
$55m (3.0%) to $1,803m primarily as a result of the disposal of owned
hotels in line with the Group’s asset-light strategy. Operating profit
before exceptional items increased by $29m (4.5%) to $680m.
On 16 January 2015, the Group completed the acquisition of Kimpton
Holding Group LLC (Kimpton) for cash consideration of $430m before
working capital adjustments and cash acquired, resulting in the addition
of 62 hotels (11,325 rooms) into the IHG System.
On 20 May 2015, the Group completed the sale of InterContinental
Paris – Le Grand for gross proceeds of €330m and, on 30 September
2015, the Group completed the sale of InterContinental Hong Kong
for proceeds of $928m after final working capital adjustments
and cash tax.
On an underlyinga basis, revenue and operating profit increased by
$113m (8.0%) and $67m (11.5%) respectively. The underlying results
exclude the impact of owned hotel disposals in 2015 and the prior year,
the results of managed-lease hotels, Kimpton, and significant
liquidated damages receipts (2015: $3m; 2014: $7m).
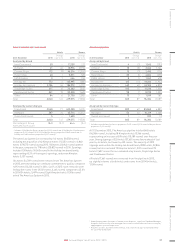
Comparable Group RevPAR increased by 4.4% (including an increase
in average daily rate of 3.1%), with growth across all regions.
IHG System size increased by 4.8% (3.2% excluding the Kimpton
acquisition) to 744,368 rooms, whilst Group fee revenueb increased
by 7.5% (3.0% excluding Kimpton).
At constant currency, net central overheads increased by $5m (3.2%)
to $160m compared to 2014 (but at actual currency decreased by $4m
(2.6%) to $151m).
Group fee margin was 46.3%, up 1.6 percentage points (up 1.3
percentage points at constant currency) on 2014, after adjusting
for owned and leased hotels, managed leases, Kimpton, and
significant liquidated damages. Group fee margin benefited from
strong growth in IHG’s scale markets, reflecting scale benefits
and tight overhead control.
Profit before tax increased by $812m to $1,412m, primarily due
to the gain on the sale of InterContinental Paris – Le Grand and
InterContinental Hong Kong. Basic earnings per ordinary share
increased by 228.5% to 520.0¢, whilst adjusted earnings per ordinary
share increased by 10.5% to 174.9¢.
Accounting principles
The Group results are prepared under International Financial
Reporting Standards (IFRS). The application of IFRS requires
management to make judgements, estimates and assumptions,
and those considered critical to the preparation of the
Group results are set out on pages 98 and 99 of the Group
Financial Statements.
The Group discloses certain financial information both including
and excluding exceptional items. For comparability of the
periods presented, some of the performance indicators in this
Performance review are calculated after eliminating these
exceptional items. Such indicators are prefixed with ‘adjusted’.
An analysis of exceptional items is included in note 5 on page
107 of the Group Financial Statements.
P
P
P
e
r
r
f
o
o
r
m
m
a
n
n
c
e
e
e
For definitions in this section, please refer to the Glossary
on pages 176 and 177.
32 IHG Annual Report and Form 20-F 2015