Holiday Inn 2015 Annual Report Download - page 113
Download and view the complete annual report
Please find page 113 of the 2015 Holiday Inn annual report below. You can navigate through the pages in the report by either clicking on the pages listed below, or by using the keyword search tool below to find specific information within the annual report.-
 1
1 -
2
-
3
-
4
-
5
-
6
-
7
-
8
-
9
-
10
-
11
-
12
-
13
-
14
-
15
-
16
-
17
-
18
-
19
-
20
-
21
-
22
-
23
-
24
-
25
-
26
-
27
-
28
-
29
-
30
-
31
-
32
-
33
-
34
-
35
-
36
-
37
-
38
-
39
-
40
-
41
-
42
-
43
-
44
-
45
-
46
-
47
-
48
-
49
-
50
-
51
-
52
-
53
-
54
-
55
-
56
-
57
-
58
-
59
-
60
-
61
-
62
-
63
-
64
-
65
-
66
-
67
-
68
-
69
-
70
-
71
-
72
-
73
-
74
-
75
-
76
-
77
-
78
-
79
-
80
-
81
-
82
-
83
-
84
-
85
-
86
-
87
-
88
-
89
-
90
-
91
-
92
-
93
-
94
-
95
-
96
-
97
-
98
-
99
-
100
-
101
-
102
-
 103
103 -
 104
104 -
 105
105 -
 106
106 -
 107
107 -
 108
108 -
 109
109 -
 110
110 -
 111
111 -
 112
112 -
 113
113 -
 114
114 -
 115
115 -
 116
116 -
 117
117 -
 118
118 -
 119
119 -
 120
120 -
 121
121 -
 122
122 -
 123
123 -
124
-
125
-
126
-
127
-
128
-
129
-
130
-
131
-
132
-
133
-
134
-
135
-
136
-
137
-
138
-
139
-
140
-
141
-
142
-
143
-
144
-
145
-
146
-
147
-
148
-
149
-
150
-
151
-
152
-
153
-
154
-
155
-
156
-
157
-
158
-
159
-
160
-
161
-
162
-
163
-
164
-
165
-
166
-
167
-
168
-
169
-
170
-
171
-
172
-
173
-
174
-
175
-
176
-
177
-
178
-
179
-
180
-
181
-
182
-
183
-
184
 |
 |

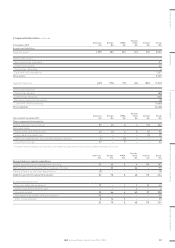
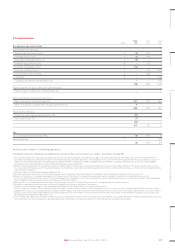
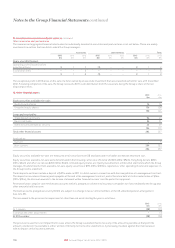
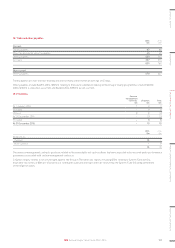
9. Earnings per ordinary share
Basic earnings per ordinary share is calculated by dividing the profit for the year available for IHG equity holders by the weighted average number
of ordinary shares, excluding investment in own shares, in issue during the year.
Diluted earnings per ordinary share is calculated by adjusting basic earnings per ordinary share to reflect the notional exercise of the weighted
average number of dilutive ordinary share awards outstanding during the year.
Adjusted earnings per ordinary share is disclosed in order to show performance undistorted by exceptional items, to give a more meaningful
comparison of the Group’s performance.
Continuing and total operations 2015 2014 2013
Basic earnings per ordinary share
Profit available for equity holders ($m) 1,222 391 372
Basic weighted average number of ordinary shares (millions) 235 247 264
Basic earnings per ordinary share (cents) 520.0 158.3 140.9
Diluted earnings per ordinary share
Profit available for equity holders ($m) 1,222 391 372
Diluted weighted average number of ordinary shares (millions) 238 250 267
Diluted earnings per ordinary share (cents) 513.4 156.4 139.3
Adjusted earnings per ordinary share
Profit available for equity holders ($m) 1,222 391 372
Adjusting items (note 5):
Exceptional operating items ($m) (819) (29) (5)
Tax on exceptional operating items ($m) 829 6
Exceptional tax ($m) ––45
Adjusted earnings ($m) 411 391 418
Basic weighted average number of ordinary shares (millions) 235 247 264
Adjusted earnings per ordinary share (cents) 174.9 158.3 158.3
Adjusted diluted earnings per ordinary share
Adjusted earnings ($m) 411 391 418
Diluted weighted average number of ordinary shares (millions) 238 250 267
Adjusted diluted earnings per ordinary share (cents) 172.7 156.4 156.6
2015
millions
2014
millions
2013
millions
Diluted weighted average number of ordinary shares is calculated as:
Basic weighted average number of ordinary shares 235 247 264
Dilutive potential ordinary shares 333
238 250 267
STRATEGIC REPORT GOVERNANCE GROUP FINANCIAL STATEMENTS ADDITIONAL INFORMATIONPARENT COMPANY FINANCIAL STATEMENTS
111IHG Annual Report and Form 20-F 2015