Holiday Inn 2015 Annual Report Download - page 73
Download and view the complete annual report
Please find page 73 of the 2015 Holiday Inn annual report below. You can navigate through the pages in the report by either clicking on the pages listed below, or by using the keyword search tool below to find specific information within the annual report.-
 1
1 -
2
-
3
-
4
-
5
-
6
-
7
-
8
-
9
-
10
-
11
-
12
-
13
-
14
-
15
-
16
-
17
-
18
-
19
-
20
-
21
-
22
-
23
-
24
-
25
-
26
-
27
-
28
-
29
-
30
-
31
-
32
-
33
-
34
-
35
-
36
-
37
-
38
-
39
-
40
-
41
-
42
-
43
-
44
-
45
-
46
-
47
-
48
-
49
-
50
-
51
-
52
-
53
-
54
-
55
-
56
-
57
-
58
-
59
-
60
-
61
-
62
-
 63
63 -
 64
64 -
 65
65 -
 66
66 -
 67
67 -
 68
68 -
 69
69 -
 70
70 -
 71
71 -
 72
72 -
 73
73 -
 74
74 -
 75
75 -
 76
76 -
 77
77 -
 78
78 -
 79
79 -
 80
80 -
 81
81 -
 82
82 -
 83
83 -
84
-
85
-
86
-
87
-
88
-
89
-
90
-
91
-
92
-
93
-
94
-
95
-
96
-
97
-
98
-
99
-
100
-
101
-
102
-
103
-
104
-
105
-
106
-
107
-
108
-
109
-
110
-
111
-
112
-
113
-
114
-
115
-
116
-
117
-
118
-
119
-
120
-
121
-
122
-
123
-
124
-
125
-
126
-
127
-
128
-
129
-
130
-
131
-
132
-
133
-
134
-
135
-
136
-
137
-
138
-
139
-
140
-
141
-
142
-
143
-
144
-
145
-
146
-
147
-
148
-
149
-
150
-
151
-
152
-
153
-
154
-
155
-
156
-
157
-
158
-
159
-
160
-
161
-
162
-
163
-
164
-
165
-
166
-
167
-
168
-
169
-
170
-
171
-
172
-
173
-
174
-
175
-
176
-
177
-
178
-
179
-
180
-
181
-
182
-
183
-
184
 |
 |

Quick read
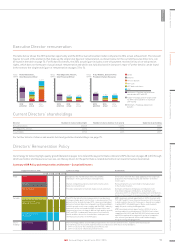
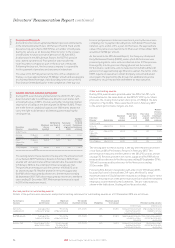
Executive Director remuneration
The table below shows the 2015 potential opportunity and the 2015 actual achievement when compared to 2014 actual achievement. The relevant
figures for each of the elements that make up the single total figure of remuneration, as shown below for the current Executive Directors, can
be found in the table on page 72. For Richard Solomons, the 2014 actual figure includes a one-off payment received in lieu of certain pension
rights, which does not form part of usual annual remuneration and which was fully disclosed in last year’s report. Further details can be found
in the notes to the single total figure of remuneration on pages 72 to 74.
Richard Solomons,
Chief Executive Officer
Paul Edgecliffe-Johnson,
Chief Financial Officer
Tracy Robbins, Executive Vice
President, Human Resources
Salary
Benefits
Pension benefit
APP cash
APP deferred shares
LTIP
Maximum = Fixed pay and maximum
award under APP and LTIP
Target = Fixed pay and on-target award
for APP (115%) and 50% of maximum
LTIP vesting
Minimum = Fixed pay and pension
benefits
0
2014
actual
6,611
4,555
3,199
1,647 1,832
1,619 2,090
2015
actual
2015
potential
1
2
3
4
5
6
7
Value
(£000)
0
2014
actual
2015
actual
2015
potential
1
2
3
4
5
6
7
Value
(£000)
0
2014
actual
2015
actual
2015
potential
1
2
3
4
5
6
7
Value
(£000)
2,227 2,607
Directors’ Remuneration Policy
Our strategy for delivering high-quality growth (detailed on pages 14 to 24) and the key performance indicators (KPIs) (set out on pages 28 to 31) through
which we monitor and measure our success, are the key drivers for the performance-related elements of our reward structure (see below):
Summary of DR Policy and remuneration architecture – Executive Directors
Implementation in 2016 Link to strategy Framework
2016 2017 2018 2019
Fixed Salary Recognises the market value of the role and the
individual’s skills, performance and experience.
Generally in line with the range applying to the corporate
population. Reviewed annually and fixed for 12 months
from 1 April.
Benefits Market-competitive and consistent with role/location;
helps recruit and retain.
Relevant benefits are restricted to the typical level
in the market location.
Pension benefit Provides funding for retirement; helps recruit and retain. Defined Contribution. Employee contributions with
matching Company contributions. A maximum cash
allowance of 30% is offered in lieu of pension contributions.
Salary is the only part of remuneration that is pensionable.
Variable Annual incentive cash (APP) The KPIs that directly link remuneration to our business
strategy include: guest satisfaction – a key measure of the
delivery of our brand strategy; OPR – measures individual
delivery of annual objectives aligned to our Winning Model;
relative growth in net rooms supply and RevPAR – industry
measures of the scale and strength of our portfolio and
the execution of our strategy to deliver high-quality growth;
EBIT and TSR – fundamental measures of our financial
health and the returns for shareholders and represent
the financial outcomes of the KPI goals.
APP: maximum annual opportunity is 200% of salary with
70% EBIT and 30% non-financial measures; 50% of award
is deferred into shares for three years. Awards are subject
to global EBIT affordability gate. Malus and clawback
apply. No post-vesting holding periods.
Annual incentive
deferred shares (APP)
LTIP: maximum annual opportunity is 205% of salary;
vesting subject to achievement of TSR (50%), net rooms
supply growth (25%) and RevPAR (25%) when measured
against an appropriate comparator group of companies
over a three-year period. Malus and clawback apply.
No post-vesting holding periods.
Long Term Incentive
Plan (LTIP)
Share-
holdings
Shareholding The following guideline shareholding requirements for our Executive Directors, together with the inclusion
of a TSR measure in our LTIP, align the interests of Directors with those of shareholders:
• 300% of salary for the Chief Executive Officer; and
• 200% of salary for other Executive Directors.
Current Directors’ shareholdings
Director Number of shares held outright Number of shares held (as % of salary) Guideline shareholding
Richard Solomons 365,625 1,227% 300%
Paul Edgecliffe-Johnson 22,014 127% 200%
Tracy Robbins 37,726 224% 200%
For further details of shares and awards held and guideline shareholdings see page 75.
STRATEGIC REPORT GOVERNANCE GROUP FINANCIAL STATEMENTS ADDITIONAL INFORMATIONPARENT COMPANY FINANCIAL STATEMENTS
71IHG Annual Report and Form 20-F 2015