Holiday Inn 2013 Annual Report Download - page 97
Download and view the complete annual report
Please find page 97 of the 2013 Holiday Inn annual report below. You can navigate through the pages in the report by either clicking on the pages listed below, or by using the keyword search tool below to find specific information within the annual report.-
 1
1 -
2
-
3
-
4
-
5
-
6
-
7
-
8
-
9
-
10
-
11
-
12
-
13
-
14
-
15
-
16
-
17
-
18
-
19
-
20
-
21
-
22
-
23
-
24
-
25
-
26
-
27
-
28
-
29
-
30
-
31
-
32
-
33
-
34
-
35
-
36
-
37
-
38
-
39
-
40
-
41
-
42
-
43
-
44
-
45
-
46
-
47
-
48
-
49
-
50
-
51
-
52
-
53
-
54
-
55
-
56
-
57
-
58
-
59
-
60
-
61
-
62
-
63
-
64
-
65
-
66
-
67
-
68
-
69
-
70
-
71
-
72
-
73
-
74
-
75
-
76
-
77
-
78
-
79
-
80
-
81
-
82
-
83
-
84
-
85
-
86
-
 87
87 -
 88
88 -
 89
89 -
 90
90 -
 91
91 -
 92
92 -
 93
93 -
 94
94 -
 95
95 -
 96
96 -
 97
97 -
 98
98 -
 99
99 -
 100
100 -
 101
101 -
 102
102 -
 103
103 -
 104
104 -
 105
105 -
 106
106 -
 107
107 -
108
-
109
-
110
-
111
-
112
-
113
-
114
-
115
-
116
-
117
-
118
-
119
-
120
-
121
-
122
-
123
-
124
-
125
-
126
-
127
-
128
-
129
-
130
-
131
-
132
-
133
-
134
-
135
-
136
-
137
-
138
-
139
-
140
-
141
-
142
-
143
-
144
-
145
-
146
-
147
-
148
-
149
-
150
-
151
-
152
-
153
-
154
-
155
-
156
-
157
-
158
-
159
-
160
-
161
-
162
-
163
-
164
-
165
-
166
-
167
-
168
-
169
-
170
-
171
-
172
-
173
-
174
-
175
-
176
-
177
-
178
-
179
-
180
-
181
-
182
-
183
-
184
-
185
-
186
-
187
-
188
-
189
-
190
-
191
-
192
 |
 |
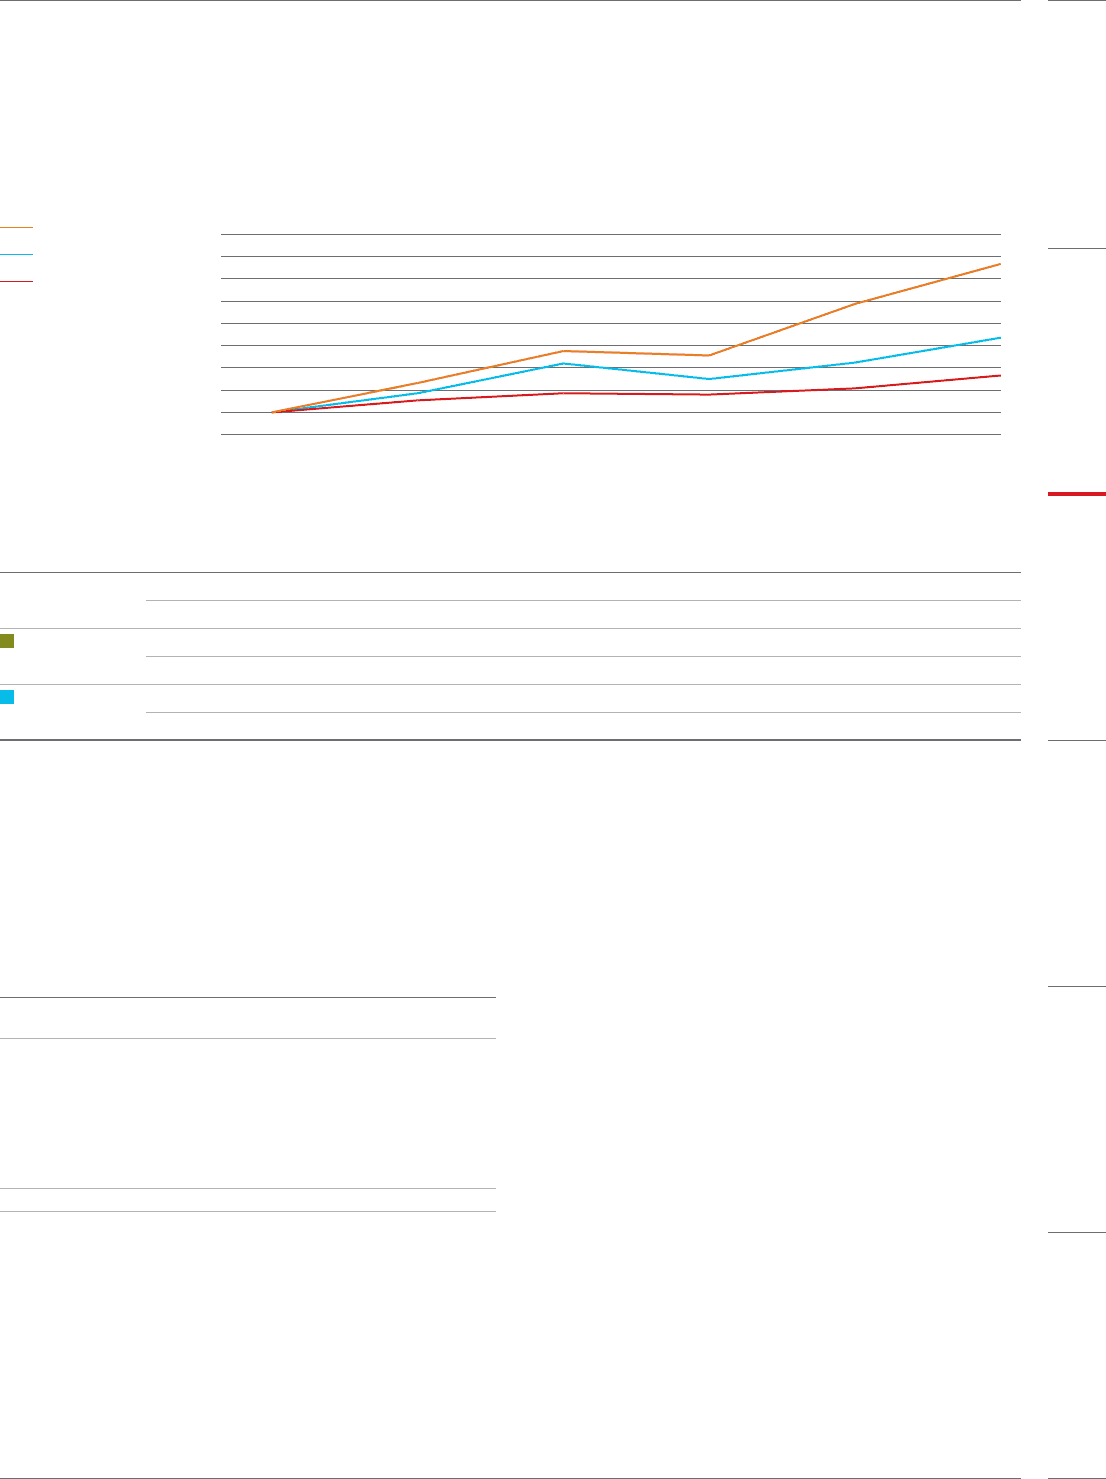
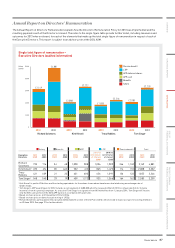
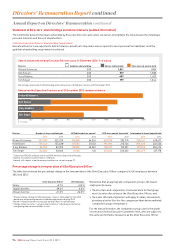
Relative performance graph and table
Throughout 2013, IHG was a member of the FTSE 100 share index and for remuneration purposes used a TSR comparator group of
theDJGH index. Accordingly, the Committee has determined that these are the most appropriate market indices against which to
test theGroup’s performance. The graph below shows the TSR performance of IHG from 31 December 2008 to 31 December 2013,
assumingdividends are reinvested, compared with the TSR performance achieved by the FTSE 100 index and the DJGH index.
All indices areshown insterling.
TSR: InterContinental Hotels Group PLC vs FTSE 100 and Dow Jones Global Hotels indices
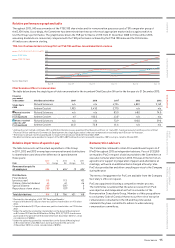
Chief Executive Officer’s remuneration
The table below shows the single figure of total remuneration for the incumbent Chief Executive Officer for the five years to 31 December 2013:
Financial
year ended
31 December Chief Executive Officer 2009 2010 201112012 2013
Single figure
£000
Richard Solomons n/a n/a 4,724 4,881 3,149
Andrew Cosslett 1,953 5,430 3,770 n/a n/a
Annual incentive
received
(% of maximum)
Richard Solomons n/a n/a 83.0 68.0 74.0
Andrew Cosslett nil2100.0 43.03n/a n/a
Shares received
under the LTIP
(% of maximum)
Richard Solomons n/a n/a 73.9 100.0 59.0
Andrew Cosslett 46.0 73.8 61.6 n/a n/a
1
Andrew Cosslett retired on 30 June 2011 and Richard Solomons was appointed Chief Executive Officer on 1 July 2011, having previously held the position of Chief
Financial Officer and Head of Commercial Development; the single figure value is the total remuneration received by each Director for that year.
2 There was no annual incentive award paid in respect of financial year ended 31 December 2009.
3 No deferred shares were awarded in respect of the 2011 ABP. Andrew Cosslett received his award as 100% cash pro-rated to 30 June 2011.
InterContinental Hotels Group PLC
DJGH Index
FTSE 100 Index
Source: Datastream
500
450
400
350
300
250
200
150
100
50
Dec 08 Dec 09 Dec 10 Dec 11 Dec 12 Dec 13
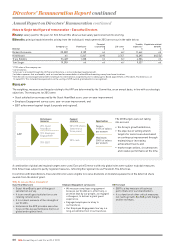
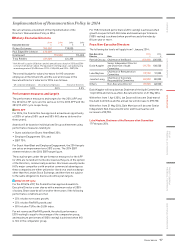
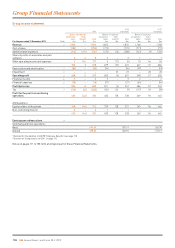
Relative importance of spend on pay
The table below sets out the actual expenditure of the Group
in2011, 2012 and 2013 on employee remuneration and distributions
to shareholders and shows the difference in spend between
thoseyears:
Item
2013
$m
%
change
2012
$m
%
change
2011
$m
Remuneration paid to
all employees
656 5
6261 (1)
6341
Distributions:
Final dividend
(previous year)
Ordinary (interim) dividend
Special dividend
Repurchase of own shares
115
63
3552
2834
113
61
5053
1075
102
46
0
0
Total distributions 816 3.8 786 431 148
1
Restated for the adoption of IAS 19R ’Employee Benefits’.
2
A special dividend of $1.33 per share was paid to shareholders on 4October
2013.
3
A special dividend of $1.72 per share was paid to shareholders on 22October
2012.
4
Under the authority granted by shareholders at the General Meeting held
on 8October 2012 and the AGM held on 24 May 2013, 9,773,912 shares were
purchased in the period from 8 October 2012 to 31 December 2013 for a total
consideration of $283m.
5
Under the authority granted by shareholders at the General Meeting held
on 8October 2012, 4,143,960 shares were purchased in the period to
31 December 2012 for a total consideration of $107m.
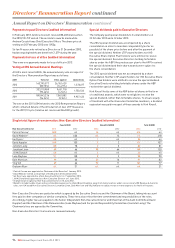
Remuneration advisers
The Committee continued to retain PricewaterhouseCoopers LLP
(PwC) throughout 2013 as independent advisers. Fees of £132,050
were paid to PwC in respect of advice provided to the Committee on
executive remuneration matters in 2013. This was in the form of an
agreed fee for support in preparation of papers and attendance at
meetings, with work on additional items charged at hourly rates.
PwC also provided tax and other consulting services to the Company
during the year.
The terms of engagement for PwC are available from the Company
Secretary’s office on request.
PwC was appointed following acompetitive tender process.
The Committee is satisfied that the advice received from PwC
was objective and independent as PwC is a member of the
Remuneration Consultants Group. Members of this group adhere
to a voluntary Code of Conduct that sets out the role of executive
remuneration consultants in the UK and the professional
standards they have committed to adhere to when advising
remuneration committees.
Governance 95
OVERVIEW STRATEGIC REPORT GOVERNANCE
GROUP
FINANCIAL STATEMENTS
PARENT COMPANY
FINANCIAL STATEMENTS ADDITIONAL INFORMATION