Holiday Inn 2013 Annual Report Download - page 17
Download and view the complete annual report
Please find page 17 of the 2013 Holiday Inn annual report below. You can navigate through the pages in the report by either clicking on the pages listed below, or by using the keyword search tool below to find specific information within the annual report.-
 1
1 -
2
-
3
-
4
-
5
-
6
-
 7
7 -
 8
8 -
 9
9 -
 10
10 -
 11
11 -
 12
12 -
 13
13 -
 14
14 -
 15
15 -
 16
16 -
 17
17 -
 18
18 -
 19
19 -
 20
20 -
 21
21 -
 22
22 -
 23
23 -
 24
24 -
 25
25 -
 26
26 -
 27
27 -
28
-
29
-
30
-
31
-
32
-
33
-
34
-
35
-
36
-
37
-
38
-
39
-
40
-
41
-
42
-
43
-
44
-
45
-
46
-
47
-
48
-
49
-
50
-
51
-
52
-
53
-
54
-
55
-
56
-
57
-
58
-
59
-
60
-
61
-
62
-
63
-
64
-
65
-
66
-
67
-
68
-
69
-
70
-
71
-
72
-
73
-
74
-
75
-
76
-
77
-
78
-
79
-
80
-
81
-
82
-
83
-
84
-
85
-
86
-
87
-
88
-
89
-
90
-
91
-
92
-
93
-
94
-
95
-
96
-
97
-
98
-
99
-
100
-
101
-
102
-
103
-
104
-
105
-
106
-
107
-
108
-
109
-
110
-
111
-
112
-
113
-
114
-
115
-
116
-
117
-
118
-
119
-
120
-
121
-
122
-
123
-
124
-
125
-
126
-
127
-
128
-
129
-
130
-
131
-
132
-
133
-
134
-
135
-
136
-
137
-
138
-
139
-
140
-
141
-
142
-
143
-
144
-
145
-
146
-
147
-
148
-
149
-
150
-
151
-
152
-
153
-
154
-
155
-
156
-
157
-
158
-
159
-
160
-
161
-
162
-
163
-
164
-
165
-
166
-
167
-
168
-
169
-
170
-
171
-
172
-
173
-
174
-
175
-
176
-
177
-
178
-
179
-
180
-
181
-
182
-
183
-
184
-
185
-
186
-
187
-
188
-
189
-
190
-
191
-
192
 |
 |

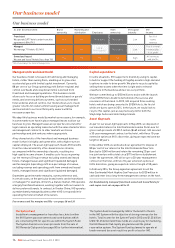
2012
2013 $236m
$230m
2012
2013 $82m
$81m
2012
2013 $400m†
$436m
2012
2013 $105m†
$112m
2012
2013 $230m†
$218m
2012
2013 $86m†
$88m
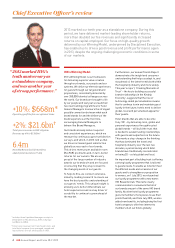
2013 Full-year dividend
Group
$1,903m†
$668m†
35,467
65,461
70.0¢ (43.2p)
Total revenue
Total operating profit before
exceptionalitems
New rooms opened globally in 2013
New rooms signed into pipeline in 2013
Operating profit before
exceptional items
Operating profit before
exceptional items
Operating profit before
exceptional items
Revenue
Revenue
Revenue
Greater China
Europe
Asia, Middle East
& Africa (AMEA)
Total
38 10 196 312 – – 4,697∞
8,818 3,701 21,518 29,778 – – 686,873∞
3,163 (14) 120 (1) 8,728 (80) 6,914 (80) 880 (5) 6,804 (21) 180,461 (1,120)
∞ Includes 21,210 rooms (91 hotels) which are unbranded.
Strategic Report 15
OVERVIEW STRATEGIC REPORT GOVERNANCE
GROUP
FINANCIAL STATEMENTS
PARENT COMPANY
FINANCIAL STATEMENTS ADDITIONAL INFORMATION