Holiday Inn 2013 Annual Report Download - page 145
Download and view the complete annual report
Please find page 145 of the 2013 Holiday Inn annual report below. You can navigate through the pages in the report by either clicking on the pages listed below, or by using the keyword search tool below to find specific information within the annual report.-
 1
1 -
2
-
3
-
4
-
5
-
6
-
7
-
8
-
9
-
10
-
11
-
12
-
13
-
14
-
15
-
16
-
17
-
18
-
19
-
20
-
21
-
22
-
23
-
24
-
25
-
26
-
27
-
28
-
29
-
30
-
31
-
32
-
33
-
34
-
35
-
36
-
37
-
38
-
39
-
40
-
41
-
42
-
43
-
44
-
45
-
46
-
47
-
48
-
49
-
50
-
51
-
52
-
53
-
54
-
55
-
56
-
57
-
58
-
59
-
60
-
61
-
62
-
63
-
64
-
65
-
66
-
67
-
68
-
69
-
70
-
71
-
72
-
73
-
74
-
75
-
76
-
77
-
78
-
79
-
80
-
81
-
82
-
83
-
84
-
85
-
86
-
87
-
88
-
89
-
90
-
91
-
92
-
93
-
94
-
95
-
96
-
97
-
98
-
99
-
100
-
101
-
102
-
103
-
104
-
105
-
106
-
107
-
108
-
109
-
110
-
111
-
112
-
113
-
114
-
115
-
116
-
117
-
118
-
119
-
120
-
121
-
122
-
123
-
124
-
125
-
126
-
127
-
128
-
129
-
130
-
131
-
132
-
133
-
134
-
 135
135 -
 136
136 -
 137
137 -
 138
138 -
 139
139 -
 140
140 -
 141
141 -
 142
142 -
 143
143 -
 144
144 -
 145
145 -
 146
146 -
 147
147 -
 148
148 -
 149
149 -
 150
150 -
 151
151 -
 152
152 -
 153
153 -
 154
154 -
 155
155 -
156
-
157
-
158
-
159
-
160
-
161
-
162
-
163
-
164
-
165
-
166
-
167
-
168
-
169
-
170
-
171
-
172
-
173
-
174
-
175
-
176
-
177
-
178
-
179
-
180
-
181
-
182
-
183
-
184
-
185
-
186
-
187
-
188
-
189
-
190
-
191
-
192
 |
 |

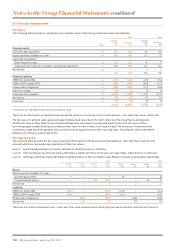
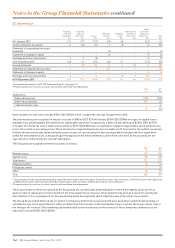
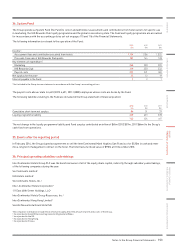
26. Retirement benefits continued
Re-measurement gains and losses recognised in the Group statement of comprehensive income are:
2013 2012120111
Plan
assets
$m
Plan
obligations
$m
Total
$m
Plan
assets
$m
Plan
obligations
$m
Total
$m
Plan
assets
$m
Plan
obligations
$m
Total
$m
Return on plan assets (excluding amounts included
in interest) 2 – 2 22 –22 27 –27
Actuarial gains and losses arising from changes in:
Demographic assumptions –12 12 –(6) (6) –(1) (1)
Financial assumptions –(57) (57) –(25) (25) –(52) (52)
Experience adjustments –(6) (6) –17 17 – 2 2
Change in asset restriction (excluding amounts included
in interest) 89 –89 (23) –(23) (8) – (8)
Other comprehensive income 91 (51) 40 (1) (14) (15) 19 (51) (32)
1 Restated for the adoption of IAS 19R ‘Employee Benefits’ (see page 111).
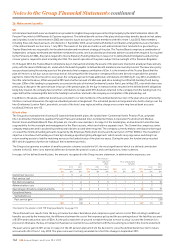
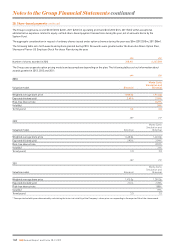
The assets and liabilities of the schemes and the amounts recognised in the Group statement of financial position are:
Pension plans
UK
US and
other
Post-
employment
benefits Total
2013
$m
2012
$m
2013
$m
2012
$m
2013
$m
2012
$m
2013
$m
2012
$m
Retirement benefit assets
Fair value of plan assets 582 695 17 17 ––599 712
Present value of benefit obligations (577) (507) (13) (15) ––(590) (522)
Surplus in schemes 5188 42––9190
Asset restriction (2) (91) ––––(2) (91)
Total retirement benefit assets 397 42––799
Retirement benefit obligations
Fair value of plan assets ––142 132 ––142 132
Present value of benefit obligations (82) (62) (220) (232) (24) (25) (326) (319)
Total retirement benefit obligations (82) (62) (78) (100) (24) (25) (184) (187)
Total fair value of plan assets 582 695 159 149 ––741 844
Total present value of benefit obligations (659) (569) (233) (247) (24) (25) (916) (841)
The ‘US and other’ surplus of $4m (2012 $2m) relates to a defined benefit pension scheme in Hong Kong. Included within the ‘US and other’
deficit is $2m (2012 $2m) relating to a defined benefit pension plan in the Netherlands.
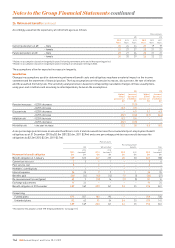
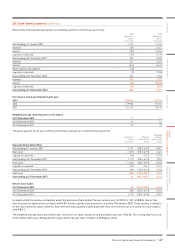
Assumptions
The principal financial assumptions used by the actuaries to determine the benefit obligations are:
Pension plans
UK US
Post-employment
benefits
2013
%
2012
%
2011
%
2013
%
2012
%
2011
%
2013
%
2012
%
2011
%
Wages and salaries increases –4.5 4.6 –– – –4.0 4.0
Pensions increases 3.6 3.0 3.1 –– – –– –
Discount rate 4.6 4.5 4.7 4.5 3.5 4.1 4.6 3.5 4.1
Inflation rate 3.6 3.0 3.1 –– – –– –
Healthcare cost trend rate assumed for next year:
Pre 65 (ultimate rate reached in 2021) 8.5 9.0 9.5
Post 65 (ultimate rate reached in 2023) 17.5 11.8 12.8
Ultimate rate that the cost trend rate trends to 5.2 5.0 5.0
Mortality is the most significant demographic assumption. The current assumptions for the UK plan are based on the S1NA tables with long
cohort projections and a 1.25% per annum underpin to future mortality improvements with age rated down by 1.75 years for pensioners and
1.5 years for non-pensioners. In the US, the current assumptions are based on the RP2000 Generational with Scale BB 2D mortality tables.
Notes to the Group Financial Statements 143
OVERVIEW STRATEGIC REPORT GOVERNANCE
GROUP
FINANCIAL STATEMENTS
PARENT COMPANY
FINANCIAL STATEMENTS ADDITIONAL INFORMATION