Holiday Inn 2013 Annual Report Download - page 44
Download and view the complete annual report
Please find page 44 of the 2013 Holiday Inn annual report below. You can navigate through the pages in the report by either clicking on the pages listed below, or by using the keyword search tool below to find specific information within the annual report.-
 1
1 -
2
-
3
-
4
-
5
-
6
-
7
-
8
-
9
-
10
-
11
-
12
-
13
-
14
-
15
-
16
-
17
-
18
-
19
-
20
-
21
-
22
-
23
-
24
-
25
-
26
-
27
-
28
-
29
-
30
-
31
-
32
-
33
-
 34
34 -
 35
35 -
 36
36 -
 37
37 -
 38
38 -
 39
39 -
 40
40 -
 41
41 -
 42
42 -
 43
43 -
 44
44 -
 45
45 -
 46
46 -
 47
47 -
 48
48 -
 49
49 -
 50
50 -
 51
51 -
 52
52 -
 53
53 -
 54
54 -
55
-
56
-
57
-
58
-
59
-
60
-
61
-
62
-
63
-
64
-
65
-
66
-
67
-
68
-
69
-
70
-
71
-
72
-
73
-
74
-
75
-
76
-
77
-
78
-
79
-
80
-
81
-
82
-
83
-
84
-
85
-
86
-
87
-
88
-
89
-
90
-
91
-
92
-
93
-
94
-
95
-
96
-
97
-
98
-
99
-
100
-
101
-
102
-
103
-
104
-
105
-
106
-
107
-
108
-
109
-
110
-
111
-
112
-
113
-
114
-
115
-
116
-
117
-
118
-
119
-
120
-
121
-
122
-
123
-
124
-
125
-
126
-
127
-
128
-
129
-
130
-
131
-
132
-
133
-
134
-
135
-
136
-
137
-
138
-
139
-
140
-
141
-
142
-
143
-
144
-
145
-
146
-
147
-
148
-
149
-
150
-
151
-
152
-
153
-
154
-
155
-
156
-
157
-
158
-
159
-
160
-
161
-
162
-
163
-
164
-
165
-
166
-
167
-
168
-
169
-
170
-
171
-
172
-
173
-
174
-
175
-
176
-
177
-
178
-
179
-
180
-
181
-
182
-
183
-
184
-
185
-
186
-
187
-
188
-
189
-
190
-
191
-
192
 |
 |

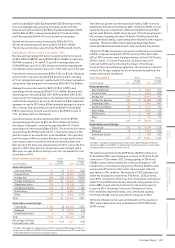
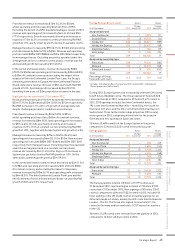
Americas results 12 months ended 31 December
2013
$m
2012
$m
2013 vs
2012 %
change
2011
$m
2012 vs
2011 %
change
Revenue
Franchised 576 541 6.5 502 7.8
Managed 128 97 32.0 124 (21.8)
Owned and leased 212 199 6.5 204 (2.5)
Total 916 837 9.4 830 0.8
Percentage of
Group Revenue 48.1 45.6 2.5 46.9 (1.3)
Operating profit before
exceptional items
Franchised 499 466 7.1 431 8.1
Managed 74 48 54.2 52 (7.7)
Owned and leased 30 24 25.0 17 41.2
603 538 12.1 500 7.6
Regional overheads (53) (52) (1.9) (49) (6.1)
Total 550 486 13.2 451 7.8
Percentage of Group
Operating profit before
central overheads and
exceptional items
66.8 63.4 3.4 64.2 (0.8)
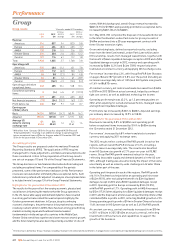
Highlights for the year ended 31 December 2013
In The Americas, the largest proportion of rooms is operated
under the franchise business model (91% of rooms in The Americas
operate under this model) primarily in the upper midscale segment
(Holiday Inn brand family). Similarly, in the upscale segment,
Crowne Plaza is predominantly franchised, whereas the majority
of the InterContinental branded hotels are operated under franchise
and management agreements. With 3,616 hotels (451,424 rooms),
The Americas represented 66% of the Group’s room count and 67%
of the Group’s operating profit before central overheads and
exceptional operating items during the year ended 31 December
2013. The key profit producing region is the US, although the Group
is also represented in each of Latin America, Canada, Mexico and
the Caribbean.
In 2013, the Group focused on the continued development of its
preferred brands and the deployment of IHG operational tools
across the estate. 13 Crowne Plaza hotels left the Americas
System partly reflecting the impact of the Crowne Plaza
repositioning programme, and for our newest brand,
EVEN Hotels, four new hotels were added to the pipeline, with the
first expected to open in 2014. For Holiday Inn the focus on quality
continued and 57 hotels were removed from the Americas System
whilst 115 new Holiday Inn brand family hotels were opened.
Revenue and operating profit before exceptional items increased by
$79m (9.4%) to $916m and by $64m (13.2%) to $550m respectively.
On an underlying basis, revenue and operating profit increased by
$52m (6.5%) and $36m (7.5%) respectively. Revenue and operating
profit were adversely impacted by $8m lower fees on the exit of eight
Holiday Inn hotels owned by FelCor Lodging Trust but were positively
impacted by the benefit of a $31m liquidated damages receipt in 2013
in the managed business, compared to $3m in 2012.
The franchise business drove most of the growth in the region
(excluding the liquidated damages in the managed estate).
Franchised revenue increased by $35m (6.5%) to $576m.
Royalties growth of 4.7% was driven by RevPAR growth of 3.2%,
including 3.4% for Holiday Inn Express, together with a 0.7%
increase in available rooms. Operating profit increased by $33m
(7.1%) to $499m. Fees from initial franchising, relicensing and
termination of hotels also increased by $6m compared to 2012.
Managed revenue increased by $31m (32.0%) to $128m and operating
profit increased by $26m (54.2%) to $74m. Revenue and operating
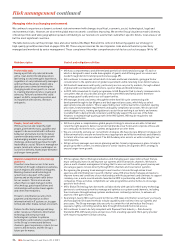
2014 priorities
• Strengthen Holiday Inn brand family leadership position
by focusing the ‘mixing business with pleasure’ and
‘family time’ guest occasion segments;
• continue to grow the Holiday Inn Express brand through
innovations which meet the needs of the ‘smart traveller’
target guest;
• continue to execute the multi-year programme to strengthen
the Crowne Plaza Hotels & Resorts brand by increasing
quality and consistency and enhancing the guest experience
in the ‘business productivity’ guest occasion segment;
• build on the pipeline of the EVEN Hotels brand and support
the opening of our first hotels for the brand; and
• drive high-quality revenues at our hotels by continuing to
embed our operational tools, strengthening hotel-level
capabilities through certifications, and driving revenue
through our direct channels.
Maximise the performance and growth of our portfolio of
preferred brands, focusing on our core upper midscale and
upscale segments, mostly through franchise agreements,
over the next three years.
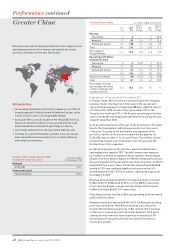
Americas comparable RevPAR movement
onprevious year
12 months
ended
31December
2013
Franchised Managed
Crowne Plaza 4.8% InterContinental 12.6%
Holiday Inn 2.6% Crowne Plaza 13.9%
Holiday Inn
Express 3.4% Holiday Inn 10.6%
All brands 3.2% Staybridge Suites 19.8%
Candlewood Suites 19.3%
All brands 13.9%
Owned and leased
All brands 6.0%
Performance continued
42 IHG Annual Report and Form 20-F 2013
The Americas