Holiday Inn 2013 Annual Report Download - page 106
Download and view the complete annual report
Please find page 106 of the 2013 Holiday Inn annual report below. You can navigate through the pages in the report by either clicking on the pages listed below, or by using the keyword search tool below to find specific information within the annual report.-
 1
1 -
2
-
3
-
4
-
5
-
6
-
7
-
8
-
9
-
10
-
11
-
12
-
13
-
14
-
15
-
16
-
17
-
18
-
19
-
20
-
21
-
22
-
23
-
24
-
25
-
26
-
27
-
28
-
29
-
30
-
31
-
32
-
33
-
34
-
35
-
36
-
37
-
38
-
39
-
40
-
41
-
42
-
43
-
44
-
45
-
46
-
47
-
48
-
49
-
50
-
51
-
52
-
53
-
54
-
55
-
56
-
57
-
58
-
59
-
60
-
61
-
62
-
63
-
64
-
65
-
66
-
67
-
68
-
69
-
70
-
71
-
72
-
73
-
74
-
75
-
76
-
77
-
78
-
79
-
80
-
81
-
82
-
83
-
84
-
85
-
86
-
87
-
88
-
89
-
90
-
91
-
92
-
93
-
94
-
95
-
 96
96 -
 97
97 -
 98
98 -
 99
99 -
 100
100 -
 101
101 -
 102
102 -
 103
103 -
 104
104 -
 105
105 -
 106
106 -
 107
107 -
 108
108 -
 109
109 -
 110
110 -
 111
111 -
 112
112 -
 113
113 -
 114
114 -
 115
115 -
 116
116 -
117
-
118
-
119
-
120
-
121
-
122
-
123
-
124
-
125
-
126
-
127
-
128
-
129
-
130
-
131
-
132
-
133
-
134
-
135
-
136
-
137
-
138
-
139
-
140
-
141
-
142
-
143
-
144
-
145
-
146
-
147
-
148
-
149
-
150
-
151
-
152
-
153
-
154
-
155
-
156
-
157
-
158
-
159
-
160
-
161
-
162
-
163
-
164
-
165
-
166
-
167
-
168
-
169
-
170
-
171
-
172
-
173
-
174
-
175
-
176
-
177
-
178
-
179
-
180
-
181
-
182
-
183
-
184
-
185
-
186
-
187
-
188
-
189
-
190
-
191
-
192
 |
 |

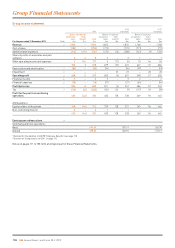
Group income statement
2013
2012
(restated1)
20112
(restated1)
For the year ended 31 December 2013 Note
Before
exceptional
items
$m
Exceptional
items
(note 5)
$m
Total
$m
Before
exceptional
items
$m
Exceptional
items
(note 5)
$m
Total
$m
Before
exceptional
items
$m
Exceptional
items
(note 5)
$m
Total
$m
Revenue 21,903 –1,903 1,835 –1,835 1,768 –1,768
Cost of sales (784) –(784) (772) –(772) (771) –(771)
Administrative expenses (374) (167) (541) (372) (16) (388) (361) (9) (370)
Share of profits of associates and joint
ventures 2 6 8 3 – 3 1 – 1
Other operating income and expenses 6166 172 5(11) (6) 10 46 56
753 5758 699 (27) 672 647 37 684
Depreciation and amortisation 2(85) –(85) (94) –(94) (99) –(99)
Impairment 2– – – –23 23 –20 20
Operating profit 2668 5673 605 (4) 601 548 57 605
Financial income 65 – 5 3 – 3 2 – 2
Financial expenses 6(78) –(78) (57) –(57) (64) –(64)
Profit before tax 595 5600 551 (4) 547 486 57 543
Tax 7(175) (51) (226) (151) 142 (9) (117) 39 (78)
Profit for the year from continuing
operations 420 (46) 374 400 138 538 369 96 465
Attributable to:
Equity holders of the parent 418 (46) 372 399 138 537 369 96 465
Non-controlling interest 2 – 2 1 – 1 – – –
420 (46) 374 400 138 538 369 96 465
Earnings per ordinary share 9
Continuing and total operations:
Basic 140.9¢ 187.1 ¢ 160.9¢
Diluted 139.3¢ 183.9¢ 157.1 ¢
1 Restated for the adoption of IAS I9R ‘Employee Benefits’ (see page 111).
2 See note on ‘Comparatives for 2011’ on page 111.
Notes on pages 111 to 153 form an integral part of these Financial Statements.
104 IHG Annual Report and Form 20-F 2013
Group Financial Statements