Holiday Inn 2013 Annual Report Download - page 141
Download and view the complete annual report
Please find page 141 of the 2013 Holiday Inn annual report below. You can navigate through the pages in the report by either clicking on the pages listed below, or by using the keyword search tool below to find specific information within the annual report.-
 1
1 -
2
-
3
-
4
-
5
-
6
-
7
-
8
-
9
-
10
-
11
-
12
-
13
-
14
-
15
-
16
-
17
-
18
-
19
-
20
-
21
-
22
-
23
-
24
-
25
-
26
-
27
-
28
-
29
-
30
-
31
-
32
-
33
-
34
-
35
-
36
-
37
-
38
-
39
-
40
-
41
-
42
-
43
-
44
-
45
-
46
-
47
-
48
-
49
-
50
-
51
-
52
-
53
-
54
-
55
-
56
-
57
-
58
-
59
-
60
-
61
-
62
-
63
-
64
-
65
-
66
-
67
-
68
-
69
-
70
-
71
-
72
-
73
-
74
-
75
-
76
-
77
-
78
-
79
-
80
-
81
-
82
-
83
-
84
-
85
-
86
-
87
-
88
-
89
-
90
-
91
-
92
-
93
-
94
-
95
-
96
-
97
-
98
-
99
-
100
-
101
-
102
-
103
-
104
-
105
-
106
-
107
-
108
-
109
-
110
-
111
-
112
-
113
-
114
-
115
-
116
-
117
-
118
-
119
-
120
-
121
-
122
-
123
-
124
-
125
-
126
-
127
-
128
-
129
-
130
-
 131
131 -
 132
132 -
 133
133 -
 134
134 -
 135
135 -
 136
136 -
 137
137 -
 138
138 -
 139
139 -
 140
140 -
 141
141 -
 142
142 -
 143
143 -
 144
144 -
 145
145 -
 146
146 -
 147
147 -
 148
148 -
 149
149 -
 150
150 -
 151
151 -
152
-
153
-
154
-
155
-
156
-
157
-
158
-
159
-
160
-
161
-
162
-
163
-
164
-
165
-
166
-
167
-
168
-
169
-
170
-
171
-
172
-
173
-
174
-
175
-
176
-
177
-
178
-
179
-
180
-
181
-
182
-
183
-
184
-
185
-
186
-
187
-
188
-
189
-
190
-
191
-
192
 |
 |
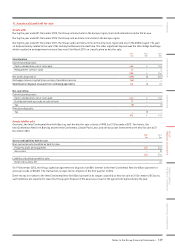
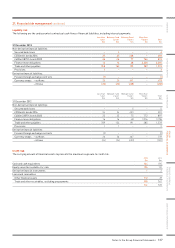
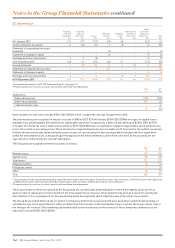
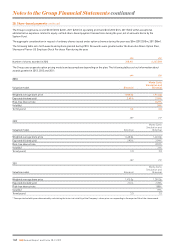
22. Loans and other borrowings continued
Facilities provided by banks
2013 2012
Utilised
$m
Unutilised
$m
Total
$m
Utilised
$m
Unutilised
$m
Total
$m
Committed 41,070 1,074 51,070 1,075
Uncommitted –80 80 –96 96
41,150 1,154 51,166 1,171
2013
$m
2012
$m
Unutilised facilities expire:
Within one year 80 96
After two but before five years 1,070 1,070
1,150 1,166
Utilised facilities are calculated based on actual drawings and may not agree to the carrying value of loans held at amortised cost.
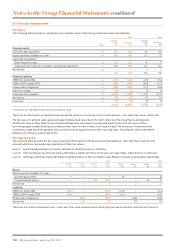
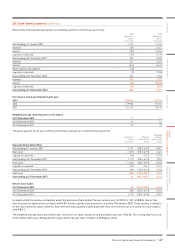
23. Derivative financial instruments
2013
$m
2012
$m
Currency swaps 11 19
Forward foreign exchange contracts (1) (2)
10 17
Analysed as:
Current assets (1) (2)
Non-current liabilities 11 19
10 17
Derivatives are recorded at their fair values as set out in note 24.
Currency swaps
At 31 December 2013, the Group held currency swaps with a principal of $415m (2012 $415m). These swaps were transacted at the same
time as the £250m 6% bonds were issued in December 2009 in order to swap the bonds’ proceeds and interest flows into US dollars.
Under the terms of the swaps, $415m was borrowed and £250m deposited for seven years at a fixed exchange rate of £1 = $1.66. The fair
value of the currency swap comprises two components: $2m (2012 $11m) relating to the repayment of the underlying principal and $9m
(2012 $8m) relating to interest payments. The element relating to the underlying principal is disclosed as a component of net debt (see
note 25). The currency swaps are designated as net investment hedges.
Forward foreign exchange contracts
At 31 December 2013, the Group held short dated foreign exchange swaps with principals of €75m (2012 €75m) and $100m (2012 $170m).
The swaps are used to manage sterling surplus cash and reduce euro and US dollar borrowings whilst maintaining operational flexibility.
The foreign exchange swaps have been designated as net investment hedges.
Notes to the Group Financial Statements 139
OVERVIEW STRATEGIC REPORT GOVERNANCE
GROUP
FINANCIAL STATEMENTS
PARENT COMPANY
FINANCIAL STATEMENTS ADDITIONAL INFORMATION