Holiday Inn 2013 Annual Report Download - page 45
Download and view the complete annual report
Please find page 45 of the 2013 Holiday Inn annual report below. You can navigate through the pages in the report by either clicking on the pages listed below, or by using the keyword search tool below to find specific information within the annual report.-
 1
1 -
2
-
3
-
4
-
5
-
6
-
7
-
8
-
9
-
10
-
11
-
12
-
13
-
14
-
15
-
16
-
17
-
18
-
19
-
20
-
21
-
22
-
23
-
24
-
25
-
26
-
27
-
28
-
29
-
30
-
31
-
32
-
33
-
34
-
 35
35 -
 36
36 -
 37
37 -
 38
38 -
 39
39 -
 40
40 -
 41
41 -
 42
42 -
 43
43 -
 44
44 -
 45
45 -
 46
46 -
 47
47 -
 48
48 -
 49
49 -
 50
50 -
 51
51 -
 52
52 -
 53
53 -
 54
54 -
 55
55 -
56
-
57
-
58
-
59
-
60
-
61
-
62
-
63
-
64
-
65
-
66
-
67
-
68
-
69
-
70
-
71
-
72
-
73
-
74
-
75
-
76
-
77
-
78
-
79
-
80
-
81
-
82
-
83
-
84
-
85
-
86
-
87
-
88
-
89
-
90
-
91
-
92
-
93
-
94
-
95
-
96
-
97
-
98
-
99
-
100
-
101
-
102
-
103
-
104
-
105
-
106
-
107
-
108
-
109
-
110
-
111
-
112
-
113
-
114
-
115
-
116
-
117
-
118
-
119
-
120
-
121
-
122
-
123
-
124
-
125
-
126
-
127
-
128
-
129
-
130
-
131
-
132
-
133
-
134
-
135
-
136
-
137
-
138
-
139
-
140
-
141
-
142
-
143
-
144
-
145
-
146
-
147
-
148
-
149
-
150
-
151
-
152
-
153
-
154
-
155
-
156
-
157
-
158
-
159
-
160
-
161
-
162
-
163
-
164
-
165
-
166
-
167
-
168
-
169
-
170
-
171
-
172
-
173
-
174
-
175
-
176
-
177
-
178
-
179
-
180
-
181
-
182
-
183
-
184
-
185
-
186
-
187
-
188
-
189
-
190
-
191
-
192
 |
 |

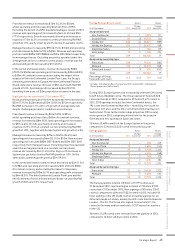
profit included $34m (2012 $34m) and $nil (2012 $nil) respectively
from one managed lease property. Excluding results from this
hotel, as well as the benefit of the $31m liquidated damages in 2013
and the $3m in 2012, revenue grew by $4m (6.7%) and operating
profit decreased by $2m (4.4%) on a constant currency basis.
Owned and leased revenue increased by $13m (6.5%) to
$212m and operating profit grew by $6m (25.0%) to $30m.
The increase in revenue was driven by RevPAR growth of 6.0%.
Highlights for the year ended 31 December 2012
Revenue and operating profit before exceptional items increased
by $7m (0.8%) to $837m and by $35m (7.8%) to $486m respectively.
RevPAR increased 6.1%, with 4.1% growth in average daily rate.
US RevPAR was up 6.3% in 2012 despite uncertainty regarding the
presidential election and the ‘fiscal cliff’ in the latter part of the year.
Franchised revenue increased by $39m (7.8%) to $541m. Royalties
growth of 8.7% was driven by RevPAR growth of 6.0%, including
6.1% for Holiday Inn Express, together with 2.3% Americas System
size growth. Operating profit increased by $35m (8.1%) to $466m.
Managed revenue decreased by $27m (21.8%) to $97m and
operating profit decreased by $4m (7.7%) to $48m. Revenue and
operating profit included $34m (2011 $59m) and $nil (2011 $1m)
respectively from managed leases. Excluding properties operated
under this arrangement, as well as the benefit of a $3m liquidated
damages receipt in 2012 and a $10m liquidated damages receipt in
2011, revenue and operating profit grew by $5m (9.1%) and $4m
(9.8%) respectively. Growth was driven by a RevPAR increase of
7.3%, including 9.6% for Holiday Inn.
Owned and leased revenue declined by $5m (2.5%) to $199m
and operating profit grew by $7m (41.2%) to $24m. Excluding
the impact of disposals, revenue increased by $4m (2.1%) and
operating profit increased by $8m (50.0%). The increase in revenue
was driven by RevPAR growth of 6.3%, offset by the impact of the
partial closure of an owned hotel in the Caribbean. The operating
profit increase of $7m included a $1m year-on-year benefit from
lower depreciation recorded for the InterContinental New York
Barclay since the hotel was categorised as held for sale in the first
quarter of 2011, after which no depreciation was charged, and a
$3m year-on-year benefit relating to one-off reorganisation costs
at one hotel in 2011.
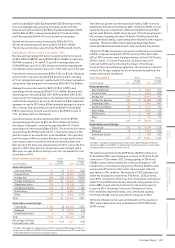
Americas hotel and room count Hotels Rooms
At 31 December 2013
Change
over 2012 2013
Change
over 2012
Analysed by brand
InterContinental 51 (2) 17,453 (303)
Crowne Plaza 176 (7) 47,057 (1,673)
Holiday Inn1786 (34) 138,830 (7,831)
Holiday Inn Express 1,985 54 174,431 6,033
Staybridge Suites 188 520,309 522
Candlewood Suites 312 13 29,778 1,103
Hotel Indigo 37 –4,344 37
Other 81 32 19,222 3,919
Total 3,616 61 451,424 1,807
Analysed by ownership type
Franchised 3,394 40 408,875 1,026
Managed 217 21 40,147 564
Owned and leased 5–2,402 217
Total 3,616 61 451,424 1,807
Percentage of Group
hotel and room count 77.0 (0.2) 65.7 (0.8)
1
Includes 10 Holiday Inn Club Vacations (3,701 rooms) and 18 Holiday Inn Resort
properties (4,438 rooms) (2012: 10 Holiday Inn Club Vacations (3,701rooms) and
17 Holiday Inn Resort properties (4,240 rooms)).
The Americas System size increased by 61 hotels (1,807 rooms) to
3,616 hotels (451,424 rooms) during 2013. 173 hotels (19,775 rooms)
opened in the year, compared to 148 hotels (16,618 rooms) in 2012
and included 33 hotels (4,061 rooms) as part of the US government’s
PAL initiative. Openings included 115 hotels (12,448 rooms) in the
Holiday Inn brand family, representing more than 60% of the region’s
openings. 19 hotels (1,705 rooms) opened as Staybridge Suites
hotels and Candlewood Suites hotels, IHG’s extended-stay brands.
112 hotels (17,968 rooms) were removed from the Americas System
in 2013, compared to 66 hotels (9,199 rooms) in 2012. More than
60% of 2013removals were Holiday Inn hotels in the US (53 hotels,
10,933 rooms). 13 Crowne Plaza hotels (3,326 rooms) were
removed in 2013, partly reflecting the impact of the Group’s
Crowne Plaza repositioning programme. The increase in removals
reflects the Group’s ongoing focus on improving the quality of the
estate, particularly Holiday Inn.
Americas pipeline Hotels Rooms
At 31 December 2013
Change
over 2012 2013
Change
over 2012
Analysed by brand
InterContinental 621,437 512
Crowne Plaza 16 –3,228 (509)
Holiday Inn1139 –19,344 517
Holiday Inn Express 358 13 33,488 1,100
Staybridge Suites 71 77,495 847
Candlewood Suites 80 26,914 172
Hotel Indigo 23 –3,118 42
EVEN Hotels 54880 650
Other 11114 114
Total 699 29 76,018 3,445
Analysed by ownership type
Franchised 678 19 72,019 1,729
Managed 18 73,499 1,216
Owned and leased 33500 500
Total 699 29 76,018 3,445
1 Includes 1 Holiday Inn Club Vacations (120 rooms) and 5 Holiday Inn Resort
properties (694 rooms) (2012: nil Holiday Inn Club Vacations (nilrooms) and 5
Holiday Inn Resort properties (640 rooms)).
The Americas pipeline totalled 699 hotels (76,018 rooms) as at
31 December 2013, representing an increase of 29 hotels (3,445
rooms) over 31 December 2012. Strong signings of 305 hotels
(33,884 rooms), demonstrating the continued demand for IHG
brand hotels, were ahead of last year by 79 hotels (8,348 rooms)
and included 35 hotels (4,118 rooms) signed as part of the US
government’s PAL initiative. The majority of 2013 signings were
within the Holiday Inn brand family (193 hotels, 20,544 rooms),
up by 8.9% compared to 2012. Four more hotels (644 rooms) were
added for the EVEN Hotels brand, taking the total pipeline to five
hotels (880 rooms), with the first hotel for the brand expected
to open in 2014. Staybridge Suites and Candlewood Suites,
IHG’s extended stay hotel brands, also contributed signings
of 57 hotels (5,406 rooms), up by 50.2% compared to 2012.
103 hotels (10,664 rooms) were terminated from the pipeline in
2013,significantly down from terminations in 2012 (183 hotels,
20,795 rooms).
Strategic Report 43
OVERVIEW STRATEGIC REPORT GOVERNANCE
GROUP
FINANCIAL STATEMENTS
PARENT COMPANY
FINANCIAL STATEMENTS ADDITIONAL INFORMATION