Holiday Inn 2013 Annual Report Download - page 46
Download and view the complete annual report
Please find page 46 of the 2013 Holiday Inn annual report below. You can navigate through the pages in the report by either clicking on the pages listed below, or by using the keyword search tool below to find specific information within the annual report.-
 1
1 -
2
-
3
-
4
-
5
-
6
-
7
-
8
-
9
-
10
-
11
-
12
-
13
-
14
-
15
-
16
-
17
-
18
-
19
-
20
-
21
-
22
-
23
-
24
-
25
-
26
-
27
-
28
-
29
-
30
-
31
-
32
-
33
-
34
-
35
-
 36
36 -
 37
37 -
 38
38 -
 39
39 -
 40
40 -
 41
41 -
 42
42 -
 43
43 -
 44
44 -
 45
45 -
 46
46 -
 47
47 -
 48
48 -
 49
49 -
 50
50 -
 51
51 -
 52
52 -
 53
53 -
 54
54 -
 55
55 -
 56
56 -
57
-
58
-
59
-
60
-
61
-
62
-
63
-
64
-
65
-
66
-
67
-
68
-
69
-
70
-
71
-
72
-
73
-
74
-
75
-
76
-
77
-
78
-
79
-
80
-
81
-
82
-
83
-
84
-
85
-
86
-
87
-
88
-
89
-
90
-
91
-
92
-
93
-
94
-
95
-
96
-
97
-
98
-
99
-
100
-
101
-
102
-
103
-
104
-
105
-
106
-
107
-
108
-
109
-
110
-
111
-
112
-
113
-
114
-
115
-
116
-
117
-
118
-
119
-
120
-
121
-
122
-
123
-
124
-
125
-
126
-
127
-
128
-
129
-
130
-
131
-
132
-
133
-
134
-
135
-
136
-
137
-
138
-
139
-
140
-
141
-
142
-
143
-
144
-
145
-
146
-
147
-
148
-
149
-
150
-
151
-
152
-
153
-
154
-
155
-
156
-
157
-
158
-
159
-
160
-
161
-
162
-
163
-
164
-
165
-
166
-
167
-
168
-
169
-
170
-
171
-
172
-
173
-
174
-
175
-
176
-
177
-
178
-
179
-
180
-
181
-
182
-
183
-
184
-
185
-
186
-
187
-
188
-
189
-
190
-
191
-
192
 |
 |
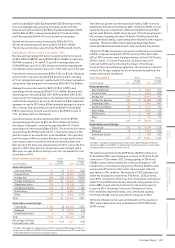
Europe results 12 months ended 31 December
2013
$m
2012
$m
2013 vs
2012 %
change
2011
$m
2012 vs
2011 %
change
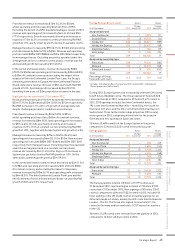
Revenue
Franchised 104 91 14.3 86 5.8
Managed 156 147 6.1 118 24.6
Owned and leased 140 198 (29.3) 201 (1.5)
Total 400 436 (8.3) 405 7.7
Percentage of
Group Revenue 21.0 23.8 (2.8) 22.9 0.9
Operating profit before
exceptional items
Franchised 79 65 21.5 65 –
Managed 30 32 (6.3) 26 23.1
Owned and leased 30 50 (40.0) 49 2.0
139 147 (5.4) 140 5.0
Regional overheads (34) (35) 2.9 (40) 12.5
Total 105 112 (6.3) 100 12.0
Percentage of Group
Operating profit before
central overheads and
exceptional items
12.8 14.6 (1.8) 14.2 0.4
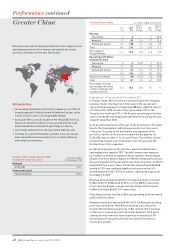
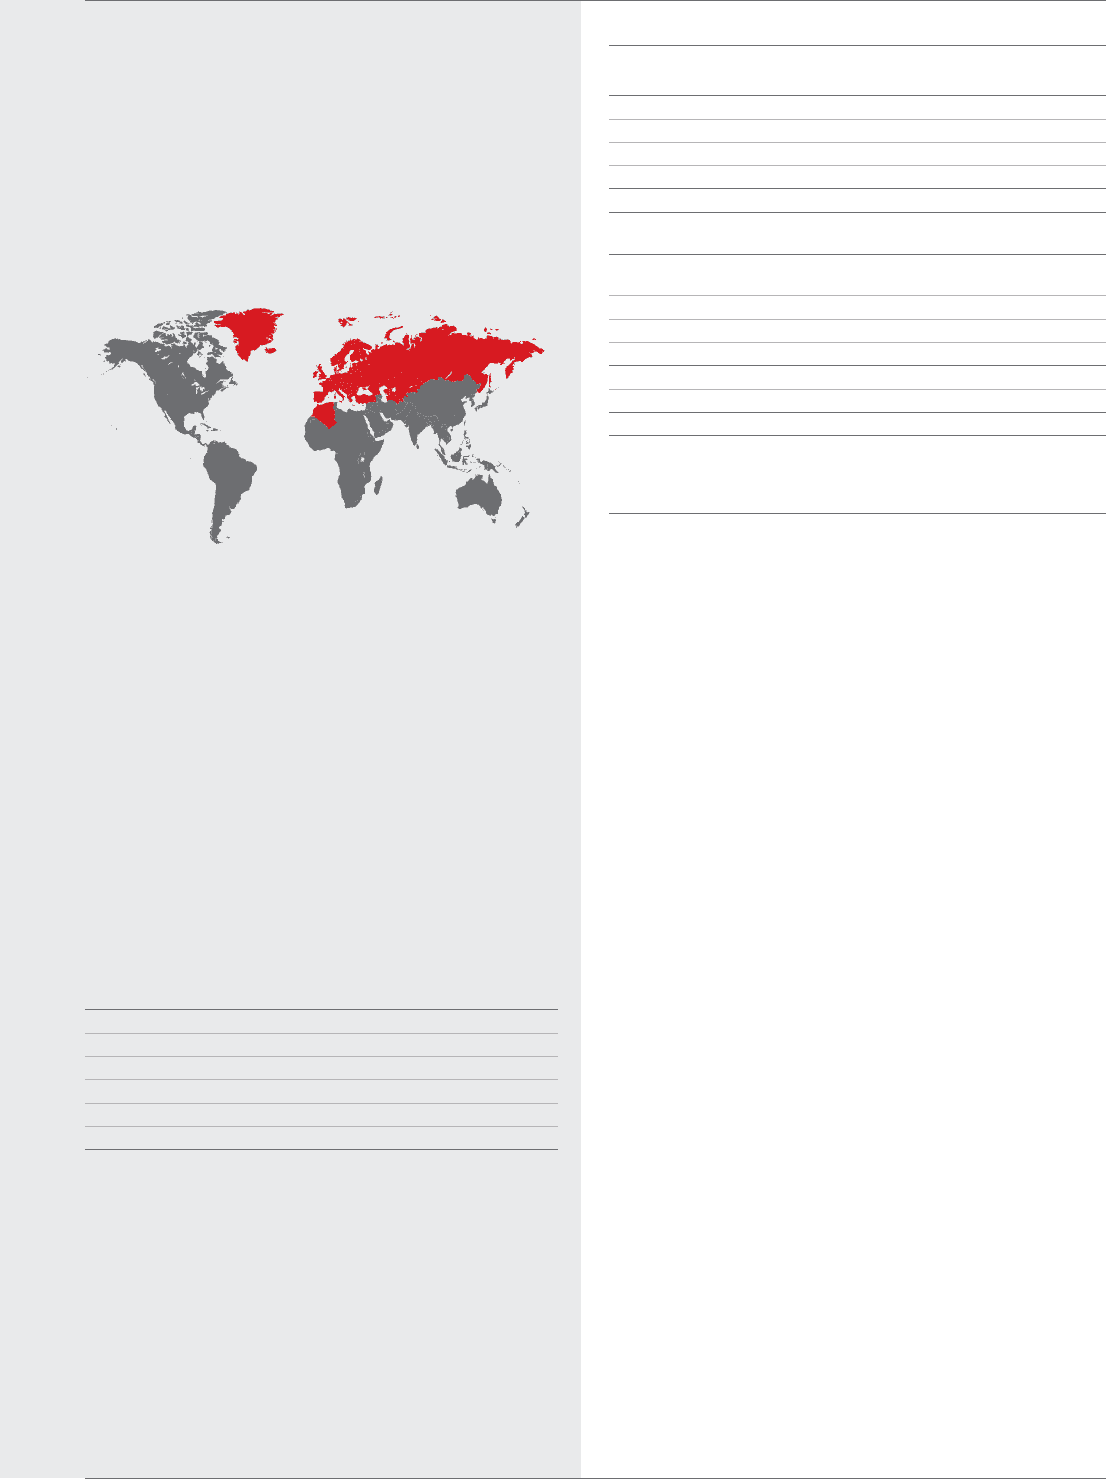
Highlights for the year ended 31 December 2013
In Europe, the largest proportion of rooms is operated under the
franchise business model primarily in the upper midscale segment
(Holiday Inn and Holiday Inn Express). Similarly, in the upscale
segment, Crowne Plaza is predominantly franchised whereas the
majority of the InterContinental branded hotels are operated under
management agreements. Comprising 629 hotels (102,066 rooms)
at the end of 2013, Europe represented 15% of the Group’s room
count and 13% of the Group’s operating profit before central
overheads and exceptional operating items during the year ended
31December 2013. Profits are primarily generated from hotels in
the UK and Continental European gateway cities.
Economic conditions across Europe in 2013 remained challenging
but the industry and the Group remained relatively resilient to this,
especially in the main markets and in 2013 good progress was
made on key priorities for the region. Three new Hotel Indigo
hotels were opened and there are now 15 in the pipeline, an
increase of two over 2012. In line with a focus on growth in priority
markets and key gateway cities, new signings totalled 50 hotels
with 18 in the UK, six in Germany and ten in the CIS. Additionally,
new openings included the InterContinental Marseille – Hotel Dieu
and the InterContinental Davos. Hotel openings were down, year
on year, but the pipeline grew and new signings increased over
2012 levels. Continued progress was made on the Group’s
asset-light strategy with the sale of the InterContinental London
Park Lane in May.
Revenue and operating profit before exceptional items decreased
by $36m (8.3%) to $400m and by $7m (6.3%) to $105m respectively.
On an underlying basis, revenue and operating profit increased by
$9m (3.4%) and $8m (10.4%) respectively. Overall, RevPAR in
Europe increased by 1.7%. The UK achieved RevPAR growth of
3.0%, with particularly strong performance in the final quarter of
2013 with RevPAR increasing 7.3%. RevPAR in Germany increased
by 0.8% despite a weaker year-on-year trade fair calendar, whilst
IHG hotels in the CIS collectively achieved RevPAR growth of 2.7%.
2014 priorities
• Accelerate growth in our priority markets and in key gateway
cities across the region;
• continue to expand Hotel Indigo across the region in key
gateway cities and launch the Holiday Inn Express brand in
the Commonwealth of Independent States (CIS);
• continue to improve guest experience and satisfaction by
creating a culture focused on quality, accelerating the rollout
of innovation and building a suite of tools that enable hotels
to deliver operational excellence; and
• deliver topline outperformance at our hotels by embedding
our revenue and sales tools, and driving our commercial
delivery and people platforms.
Continue to grow in priority markets and across key cities, and
improve underlying margin through operational excellence over
the next three years.
Europe comparable RevPAR movement
on previous year 12 months ended
31 December 2013
Franchised
All brands 1.5%
Managed
All brands 2.0%
Owned and leased
InterContinental 5.3%
Performance continued
44 IHG Annual Report and Form 20-F 2013
Europe