Holiday Inn 2013 Annual Report Download - page 107
Download and view the complete annual report
Please find page 107 of the 2013 Holiday Inn annual report below. You can navigate through the pages in the report by either clicking on the pages listed below, or by using the keyword search tool below to find specific information within the annual report.-
 1
1 -
2
-
3
-
4
-
5
-
6
-
7
-
8
-
9
-
10
-
11
-
12
-
13
-
14
-
15
-
16
-
17
-
18
-
19
-
20
-
21
-
22
-
23
-
24
-
25
-
26
-
27
-
28
-
29
-
30
-
31
-
32
-
33
-
34
-
35
-
36
-
37
-
38
-
39
-
40
-
41
-
42
-
43
-
44
-
45
-
46
-
47
-
48
-
49
-
50
-
51
-
52
-
53
-
54
-
55
-
56
-
57
-
58
-
59
-
60
-
61
-
62
-
63
-
64
-
65
-
66
-
67
-
68
-
69
-
70
-
71
-
72
-
73
-
74
-
75
-
76
-
77
-
78
-
79
-
80
-
81
-
82
-
83
-
84
-
85
-
86
-
87
-
88
-
89
-
90
-
91
-
92
-
93
-
94
-
95
-
96
-
 97
97 -
 98
98 -
 99
99 -
 100
100 -
 101
101 -
 102
102 -
 103
103 -
 104
104 -
 105
105 -
 106
106 -
 107
107 -
 108
108 -
 109
109 -
 110
110 -
 111
111 -
 112
112 -
 113
113 -
 114
114 -
 115
115 -
 116
116 -
 117
117 -
118
-
119
-
120
-
121
-
122
-
123
-
124
-
125
-
126
-
127
-
128
-
129
-
130
-
131
-
132
-
133
-
134
-
135
-
136
-
137
-
138
-
139
-
140
-
141
-
142
-
143
-
144
-
145
-
146
-
147
-
148
-
149
-
150
-
151
-
152
-
153
-
154
-
155
-
156
-
157
-
158
-
159
-
160
-
161
-
162
-
163
-
164
-
165
-
166
-
167
-
168
-
169
-
170
-
171
-
172
-
173
-
174
-
175
-
176
-
177
-
178
-
179
-
180
-
181
-
182
-
183
-
184
-
185
-
186
-
187
-
188
-
189
-
190
-
191
-
192
 |
 |

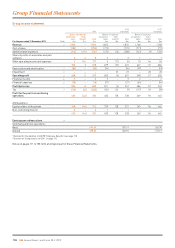
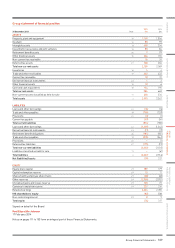
Group statement of comprehensive income
For the year ended 31 December 2013
2013
$m
2012
(restated1)
$m
20112
(restated1)
$m
Profit for the year 374 538 465
Other comprehensive income
Items that may be subsequently reclassified to profit or loss:
Gains on valuation of available-for-sale financial assets 28 115
Losses reclassified to income on impairment of available-for-sale financial assets –– 3
Losses relating to cash flow hedges reclassified to financial expenses –1 4
Exchange (losses)/gains on retranslation of foreign operations, net of related tax credit of $2m (2012
credit of $3m, 2011 charge of $3m) (35) 24 (21)
Exchange losses reclassified to profit on hotel disposal 46 – –
39 26 1
Items that will not be reclassified to profit or loss:
Re-measurement gains/(losses) on defined benefit plans, net of related tax charge of $20m (2012
credit of $5m, 2011 credit of $19m) 20 (10) (13)
Tax related to pension contributions –18 –
20 8(13)
Total other comprehensive income/(loss) for the year 59 34 (12)
Total comprehensive income for the year 433 572 453
Attributable to:
Equity holders of the parent 433 571 452
Non-controlling interest –1 1
433 572 453
1 Restated for the adoption of IAS I9R ‘Employee Benefits’ (see page 111).
2 See note on ‘Comparatives for 2011’ on page 111.
Notes on pages 111 to 153 form an integral part of these Financial Statements.
Group Financial Statements 105
OVERVIEW STRATEGIC REPORT GOVERNANCE
GROUP
FINANCIAL STATEMENTS
PARENT COMPANY
FINANCIAL STATEMENTS ADDITIONAL INFORMATION