Holiday Inn 2013 Annual Report Download - page 92
Download and view the complete annual report
Please find page 92 of the 2013 Holiday Inn annual report below. You can navigate through the pages in the report by either clicking on the pages listed below, or by using the keyword search tool below to find specific information within the annual report.
2011/13 LTIP
The performance measures for each three-year LTIP cycle are set by the Committee. Awards are made annually and eligible executives
will receive shares at the end of that cycle, subject to achievement of the performance measures. The performance measures for the
2011/13 cycle were:
• relative growth in net rooms over three years;
• relative like-for-like RevPAR growth over three years; and
• IHG’s TSR relative to the Dow Jones Global Hotel (DJGH) index.
Growth in net rooms and RevPAR is measured on a relative basis against the comparator group, comprising the following major,
globally branded competitors: Accor, Choice, Hilton, Hyatt, Marriott, Starwood and Wyndham.
These performance measures are also used for the 2012/14 and 2013/15 LTIP cycles, granted in 2012 and 2013 respectively.
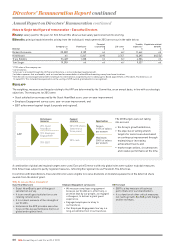
Why do we use these measures?
Net rooms growth RevPAR growth TSR vs DJGH
This measures the net growth in the total
number of IHG hotel rooms over the duration
of the cycle relative to our major global
competitors. Together with the RevPAR
measure, it provides focus on ensuring a
balance between the quality of IHG hotels
and the speed at which IHG grows.
This measures success in growing our rates
for the rooms we have open for the duration
of the cycle relative to the RevPAR growth of
our major global competitors.
This measures the return to shareholders by
investing in IHG relative to our competitors
in the appropriate comparator group,
currently the DJGH index.
In order to generate higher returns for our shareholders, we need to increase revenue share, improve operating efficiency and grow
margins through increasing the number of rooms we have available to sell, as well as generating more RevPAR for those rooms.
By focusing on both net rooms growth and RevPAR growth, we are rewarding the balanced approach to growth that will support the
long-term increase in shareholder value.
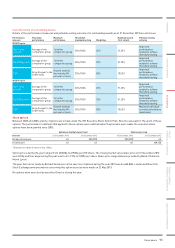
Outcome for 2011/13 cycle (audited information)
This cycle vested on 19 February 2014 as follows:
Performance
measure
Threshold
performance
Maximum
performance
Threshold/
maximum vesting Weighting
Maximum award
(% of salary at
date of award)
Actual performance
vs comparator group
Outcome
(% of maximum
award vesting)
Net rooms
growth
Average of the
comparator
group
1st in the
comparator
group
20% / 100% 25% 51.25% Below average 0%
RevPAR growth
Average of the
comparator
group
1st in the
comparator
group
20% / 100% 25% 51.25% Slightly above
average 9%
TSR
Growth equal
to the DJGH
index
Growth exceeds
the index by 8%
per year or more
20% / 100% 50% 102.5%
Growth
exceeded index by
10.4%
50%
Total vesting
outcome 59%
Net rooms and RevPAR growth were measured by reference to the three years ending 30 September 2013; TSR was measured by
reference to the three years ending 31 December 2013.
Pension benefit: the value of Company contributions to pension plans and any cash allowances paid in lieu of pension contributions.
For 2012, the figure for Richard Solomons shows the increase in his pension value as a member of the executive defined benefit section of
the IC Plan, which arose principally from his salary review when appointed Chief Executive Officer in July 2011. The defined benefit section
of the IC Plan closed to future accruals for existing members on 30 June 2013 and therefore the 2013 pension figure for Richard Solomons
also includes a cash allowance in lieu of pensions contributions for the period from 1 July 2013.
LTIP 100% IHG
shares
25% RevPAR
25% net rooms
50% TSR
Performance
measures
Payment
structure
Target:
102.5% of salary
per annum
Maximum:
205% of salary
per annum
Opportunities
90 IHG Annual Report and Form 20-F 2013
Directors’ Remuneration Report continued
Annual Report on Directors’ Remuneration continued


