Holiday Inn 2013 Annual Report Download - page 122
Download and view the complete annual report
Please find page 122 of the 2013 Holiday Inn annual report below. You can navigate through the pages in the report by either clicking on the pages listed below, or by using the keyword search tool below to find specific information within the annual report.-
 1
1 -
2
-
3
-
4
-
5
-
6
-
7
-
8
-
9
-
10
-
11
-
12
-
13
-
14
-
15
-
16
-
17
-
18
-
19
-
20
-
21
-
22
-
23
-
24
-
25
-
26
-
27
-
28
-
29
-
30
-
31
-
32
-
33
-
34
-
35
-
36
-
37
-
38
-
39
-
40
-
41
-
42
-
43
-
44
-
45
-
46
-
47
-
48
-
49
-
50
-
51
-
52
-
53
-
54
-
55
-
56
-
57
-
58
-
59
-
60
-
61
-
62
-
63
-
64
-
65
-
66
-
67
-
68
-
69
-
70
-
71
-
72
-
73
-
74
-
75
-
76
-
77
-
78
-
79
-
80
-
81
-
82
-
83
-
84
-
85
-
86
-
87
-
88
-
89
-
90
-
91
-
92
-
93
-
94
-
95
-
96
-
97
-
98
-
99
-
100
-
101
-
102
-
103
-
104
-
105
-
106
-
107
-
108
-
109
-
110
-
111
-
 112
112 -
 113
113 -
 114
114 -
 115
115 -
 116
116 -
 117
117 -
 118
118 -
 119
119 -
 120
120 -
 121
121 -
 122
122 -
 123
123 -
 124
124 -
 125
125 -
 126
126 -
 127
127 -
 128
128 -
 129
129 -
 130
130 -
 131
131 -
 132
132 -
133
-
134
-
135
-
136
-
137
-
138
-
139
-
140
-
141
-
142
-
143
-
144
-
145
-
146
-
147
-
148
-
149
-
150
-
151
-
152
-
153
-
154
-
155
-
156
-
157
-
158
-
159
-
160
-
161
-
162
-
163
-
164
-
165
-
166
-
167
-
168
-
169
-
170
-
171
-
172
-
173
-
174
-
175
-
176
-
177
-
178
-
179
-
180
-
181
-
182
-
183
-
184
-
185
-
186
-
187
-
188
-
189
-
190
-
191
-
192
 |
 |

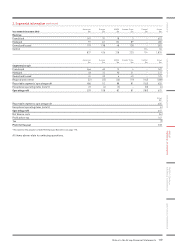
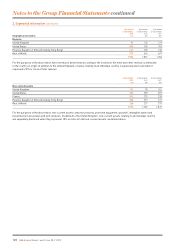
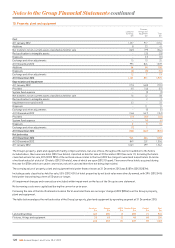
2. Segmental information continued
31 December 2012
Americas
$m
Europe
$m
AMEA
$m
Greater China
$m
Central
$m
Group
$m
Assets and liabilities
Segment assets 725 626 282 390 250 2,273
Non-current assets classified as held for sale 232 302 –––534
957 928 282 390 250 2,807
Unallocated assets:
Non-current tax receivable 24
Deferred tax assets 204
Current tax receivable 31
Derivative financial instruments 2
Cash and cash equivalents 195
Total assets 3,263
Segment liabilities (403) (249) (58) (61) (690) (1,461)
Liabilities classified as held for sale (61) ––––(61)
(464) (249) (58) (61) (690) (1,522)
Unallocated liabilities:
Current tax payable (54)
Deferred tax liabilities (93)
Loans and other borrowings (1,258)
Derivative financial instruments (19)
Total liabilities (2,946)
Year ended 31 December 2012
Americas
$m
Europe
$m
AMEA
$m
Greater China
$m
Central
$m
Group
$m
Other segmental information
Capital expenditure (see below) 25 19 6 7 76 133
Non-cash items:
Depreciation and amortisation120 23 14 15 22 94
Reversal of previously recorded impairment (23) – – – – (23)
Write-off of software – – – – 18 18
Demerger liability released ––––(9) (9)
Share-based payments cost – – – – 22 22
Share of profit of associates and joint ventures – – (3) – – (3)
1 Included in the $94m of depreciation and amortisation is $31m relating to administrative expenses and $63m relating to cost of sales.
Americas
$m
Europe
$m
AMEA
$m
Greater China
$m
Central
$m
Group
$m
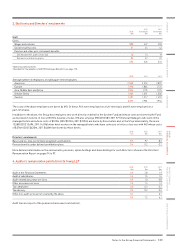
Reconciliation of capital expenditure
Capital expenditure per management reporting 25 19 6 7 76 133
Timing differences (1) ––2–1
Capital expenditure per the Financial Statements 24 19 6 9 76 134
Comprising additions to:
Property, plant and equipment 15 929641
Non-current assets classified as held for sale 5––––5
Intangible assets 2 8 4 – 70 84
Investment in associates and joint ventures 2––––2
Other financial assets –2–––2
24 19 6 9 76 134
120 IHG Annual Report and Form 20-F 2013
Notes to the Group Financial Statements continued