Holiday Inn 2013 Annual Report Download - page 51
Download and view the complete annual report
Please find page 51 of the 2013 Holiday Inn annual report below. You can navigate through the pages in the report by either clicking on the pages listed below, or by using the keyword search tool below to find specific information within the annual report.-
 1
1 -
2
-
3
-
4
-
5
-
6
-
7
-
8
-
9
-
10
-
11
-
12
-
13
-
14
-
15
-
16
-
17
-
18
-
19
-
20
-
21
-
22
-
23
-
24
-
25
-
26
-
27
-
28
-
29
-
30
-
31
-
32
-
33
-
34
-
35
-
36
-
37
-
38
-
39
-
40
-
 41
41 -
 42
42 -
 43
43 -
 44
44 -
 45
45 -
 46
46 -
 47
47 -
 48
48 -
 49
49 -
 50
50 -
 51
51 -
 52
52 -
 53
53 -
 54
54 -
 55
55 -
 56
56 -
 57
57 -
 58
58 -
 59
59 -
 60
60 -
 61
61 -
62
-
63
-
64
-
65
-
66
-
67
-
68
-
69
-
70
-
71
-
72
-
73
-
74
-
75
-
76
-
77
-
78
-
79
-
80
-
81
-
82
-
83
-
84
-
85
-
86
-
87
-
88
-
89
-
90
-
91
-
92
-
93
-
94
-
95
-
96
-
97
-
98
-
99
-
100
-
101
-
102
-
103
-
104
-
105
-
106
-
107
-
108
-
109
-
110
-
111
-
112
-
113
-
114
-
115
-
116
-
117
-
118
-
119
-
120
-
121
-
122
-
123
-
124
-
125
-
126
-
127
-
128
-
129
-
130
-
131
-
132
-
133
-
134
-
135
-
136
-
137
-
138
-
139
-
140
-
141
-
142
-
143
-
144
-
145
-
146
-
147
-
148
-
149
-
150
-
151
-
152
-
153
-
154
-
155
-
156
-
157
-
158
-
159
-
160
-
161
-
162
-
163
-
164
-
165
-
166
-
167
-
168
-
169
-
170
-
171
-
172
-
173
-
174
-
175
-
176
-
177
-
178
-
179
-
180
-
181
-
182
-
183
-
184
-
185
-
186
-
187
-
188
-
189
-
190
-
191
-
192
 |
 |

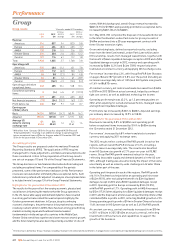
Owned and leased revenue at the InterContinental Hong Kong
increased by $3m (2.2%) to $141m, driven by a 4.5% increase in
total gross revenue derived from non-rooms business, although
this was partly offset by a RevPAR decline of 0.1%. Operating profit
increased by $2m (4.4%) to $47m.
Highlights for the year ended 31 December 2012
Revenue and operating profit before exceptional items increased by
$25m (12.2%) to $230m and by $14m (20.9%) to $81m respectively.
RevPAR increased 5.4% with 3.1% growth in average daily rate.
Franchised revenue increased by $1m (50.0%) to $3m and
operating profit by $1m (33.3%) to $4m, boosted by the opening
of the 1,224-room Holiday Inn Macao Cotai Central.
Managed revenue increased by $12m (15.6%) to $89m and operating
profit increased by $8m (18.6%) to $51m. RevPAR growth of 5.6%
reflected continued economic growth in the region, although the
whole industry was affected in the latter part of the year by the
Diaoyu/Senkaku islands territorial dispute and slower
macroeconomic conditions. There was also continued significant
Greater China System size growth for the managed estate (9.7%
rooms growth in 2012 following 14.2% rooms growth in 2011).
Owned and leased revenue increased by $12m (9.5%) to $138m and
operating profit increased by $8m (21.6%) to $45m, with RevPAR
growth of 6.7% at the InterContinental Hong Kong.
Regional costs increased by $3m (18.8%) to $19m reflecting
increased investment in operations and infrastructure in the region.
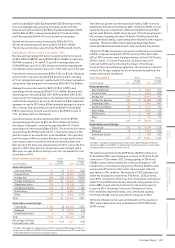
Greater China hotel and room count Hotels Rooms
At 31 December 2013
Change
over 2012 2013
Change
over 2012
Analysed by brand
InterContinental 29 711,742 2,369
Crowne Plaza 65 523,234 1,782
Holiday Inn167 321,662 885
Holiday Inn Express 42 511,295 1,842
Hotel Indigo 52612 207
Other –(1) –(141)
Total 208 21 68,545 6,944
Analysed by ownership type
Franchised 4–2,184 –
Managed 203 21 65,858 6,944
Owned and leased 1–503 –
Total 208 21 68,545 6,944
Percentage of Group
hotel and room count 4.4 0.3 10.0 0.9
1
Includes 4 Holiday Inn Resort properties (1,203 rooms) (2012: 3 Holiday Inn
Resort properties (893 rooms)).
The Greater China hotel and room count in the year increased by
21hotels (6,944 rooms) to 208 hotels (68,545 rooms). 23 hotels
(7,669rooms) opened during 2013, broadly in line with 2012.
InterContinental System size increased by 7 hotels (2,369 rooms)
to 29 hotels (11,742 rooms), with openings including the 294-room
InterContinental Sanya Haitang Bay Resort, a second for the
brand on the island resort destination of Sanya. The Group
also celebrated its 200th opening in Greater China in 2013 with
the opening of the 141-room InterContinental Shanghai Ruijin.
A further two Hotel Indigo properties (208 rooms) were opened,
including a first for the brand in Hong Kong.
Two hotels (725 rooms) were removed from the Greater China
System in 2013.
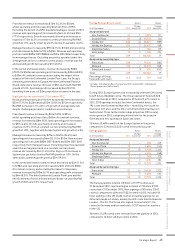
Greater China pipeline Hotels Rooms
At 31 December 2013
Change
over 2012 2013
Change
over 2012
Analysed by brand
InterContinental 22 –9,392 374
Crowne Plaza 52 –18,469 (863)
Holiday Inn141 411,944 945
Holiday Inn Express 33 47,260 1,263
Hotel Indigo 5–721 152
HUALUXE 21 66,804 1,900
Other –––(97)
Total 174 14 54,590 3,674
Analysed by ownership type
Managed 174 14 54,590 3,674
Total 174 14 54,590 3,674
1
Includes 3 Holiday Inn Resort properties (890 rooms) (2012: 3 Holiday Inn
Resort properties (850 rooms)).
The Greater China pipeline totalled 174 hotels (54,590 rooms) as
at 31 December 2013, compared to 160 hotels (50,916 rooms) as at
31 December 2012. Signings of 53 hotels (15,348 rooms) increased
from 46 hotels (13,387 rooms) in 2012. Seven InterContinental hotels
(2,129 rooms) were signed, together with 11 Crowne Plaza hotels
(3,528 rooms), whilst the total pipeline for the HUALUXE Hotels &
Resorts brand increased to 21 hotels (6,804 rooms). 26 hotels
(7,343 rooms) were signed in the Holiday Inn brand family,
including the 1,002-room Holiday Inn Express Changbaishan,
which subsequently opened as the Group’s largest Holiday Inn
Express in 2013.
16 hotels (4,005 rooms) were removed from the pipeline in 2013.
Strategic Report 49
OVERVIEW STRATEGIC REPORT GOVERNANCE
GROUP
FINANCIAL STATEMENTS
PARENT COMPANY
FINANCIAL STATEMENTS ADDITIONAL INFORMATION