Holiday Inn 2013 Annual Report Download - page 121
Download and view the complete annual report
Please find page 121 of the 2013 Holiday Inn annual report below. You can navigate through the pages in the report by either clicking on the pages listed below, or by using the keyword search tool below to find specific information within the annual report.-
 1
1 -
2
-
3
-
4
-
5
-
6
-
7
-
8
-
9
-
10
-
11
-
12
-
13
-
14
-
15
-
16
-
17
-
18
-
19
-
20
-
21
-
22
-
23
-
24
-
25
-
26
-
27
-
28
-
29
-
30
-
31
-
32
-
33
-
34
-
35
-
36
-
37
-
38
-
39
-
40
-
41
-
42
-
43
-
44
-
45
-
46
-
47
-
48
-
49
-
50
-
51
-
52
-
53
-
54
-
55
-
56
-
57
-
58
-
59
-
60
-
61
-
62
-
63
-
64
-
65
-
66
-
67
-
68
-
69
-
70
-
71
-
72
-
73
-
74
-
75
-
76
-
77
-
78
-
79
-
80
-
81
-
82
-
83
-
84
-
85
-
86
-
87
-
88
-
89
-
90
-
91
-
92
-
93
-
94
-
95
-
96
-
97
-
98
-
99
-
100
-
101
-
102
-
103
-
104
-
105
-
106
-
107
-
108
-
109
-
110
-
 111
111 -
 112
112 -
 113
113 -
 114
114 -
 115
115 -
 116
116 -
 117
117 -
 118
118 -
 119
119 -
 120
120 -
 121
121 -
 122
122 -
 123
123 -
 124
124 -
 125
125 -
 126
126 -
 127
127 -
 128
128 -
 129
129 -
 130
130 -
 131
131 -
132
-
133
-
134
-
135
-
136
-
137
-
138
-
139
-
140
-
141
-
142
-
143
-
144
-
145
-
146
-
147
-
148
-
149
-
150
-
151
-
152
-
153
-
154
-
155
-
156
-
157
-
158
-
159
-
160
-
161
-
162
-
163
-
164
-
165
-
166
-
167
-
168
-
169
-
170
-
171
-
172
-
173
-
174
-
175
-
176
-
177
-
178
-
179
-
180
-
181
-
182
-
183
-
184
-
185
-
186
-
187
-
188
-
189
-
190
-
191
-
192
 |
 |

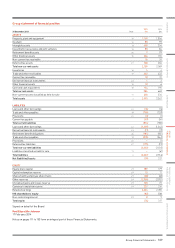
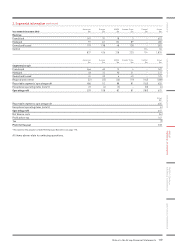
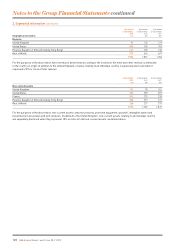
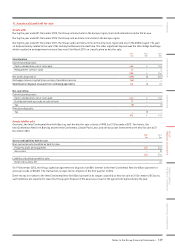
2. Segmental information continued
Year ended 31 December 20121
Americas
$m
Europe
$m
AMEA
$m
Greater China
$m
Central
$m
Group
$m
Revenue
Franchised 541 91 18 3 – 653
Managed 97 147 152 89 –485
Owned and leased 199 198 48 138 –583
Central – – – – 114 114
837 436 218 230 114 1,835
Americas
$m
Europe
$m
AMEA
$m
Greater China
$m
Central
$m
Group
$m
Segmental result
Franchised 466 65 12 4 – 547
Managed 48 32 90 51 –221
Owned and leased 24 50 645 –125
Regional and central (52) (35) (20) (19) (162) (288)
Reportable segments’ operating profit 486 112 88 81 (162) 605
Exceptional operating items (note 5) 23 (4) (5) –(18) (4)
Operating profit 509 108 83 81 (180) 601
Group
$m
Reportable segments’ operating profit 605
Exceptional operating items (note 5) (4)
Operating profit 601
Net finance costs (54)
Profit before tax 547
Tax (9)
Profit for the year 538
1 Restated for the adoption of IAS I9R ‘Employee Benefits’ (see page 111).
All items above relate to continuing operations.
Notes to the Group Financial Statements 119
OVERVIEW STRATEGIC REPORT GOVERNANCE
GROUP
FINANCIAL STATEMENTS
PARENT COMPANY
FINANCIAL STATEMENTS ADDITIONAL INFORMATION