Holiday Inn 2013 Annual Report Download - page 139
Download and view the complete annual report
Please find page 139 of the 2013 Holiday Inn annual report below. You can navigate through the pages in the report by either clicking on the pages listed below, or by using the keyword search tool below to find specific information within the annual report.-
 1
1 -
2
-
3
-
4
-
5
-
6
-
7
-
8
-
9
-
10
-
11
-
12
-
13
-
14
-
15
-
16
-
17
-
18
-
19
-
20
-
21
-
22
-
23
-
24
-
25
-
26
-
27
-
28
-
29
-
30
-
31
-
32
-
33
-
34
-
35
-
36
-
37
-
38
-
39
-
40
-
41
-
42
-
43
-
44
-
45
-
46
-
47
-
48
-
49
-
50
-
51
-
52
-
53
-
54
-
55
-
56
-
57
-
58
-
59
-
60
-
61
-
62
-
63
-
64
-
65
-
66
-
67
-
68
-
69
-
70
-
71
-
72
-
73
-
74
-
75
-
76
-
77
-
78
-
79
-
80
-
81
-
82
-
83
-
84
-
85
-
86
-
87
-
88
-
89
-
90
-
91
-
92
-
93
-
94
-
95
-
96
-
97
-
98
-
99
-
100
-
101
-
102
-
103
-
104
-
105
-
106
-
107
-
108
-
109
-
110
-
111
-
112
-
113
-
114
-
115
-
116
-
117
-
118
-
119
-
120
-
121
-
122
-
123
-
124
-
125
-
126
-
127
-
128
-
 129
129 -
 130
130 -
 131
131 -
 132
132 -
 133
133 -
 134
134 -
 135
135 -
 136
136 -
 137
137 -
 138
138 -
 139
139 -
 140
140 -
 141
141 -
 142
142 -
 143
143 -
 144
144 -
 145
145 -
 146
146 -
 147
147 -
 148
148 -
 149
149 -
150
-
151
-
152
-
153
-
154
-
155
-
156
-
157
-
158
-
159
-
160
-
161
-
162
-
163
-
164
-
165
-
166
-
167
-
168
-
169
-
170
-
171
-
172
-
173
-
174
-
175
-
176
-
177
-
178
-
179
-
180
-
181
-
182
-
183
-
184
-
185
-
186
-
187
-
188
-
189
-
190
-
191
-
192
 |
 |

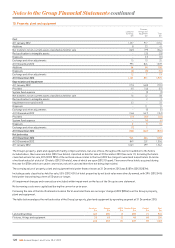
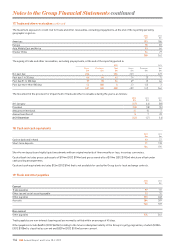
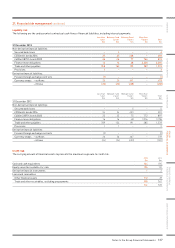
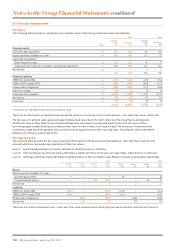
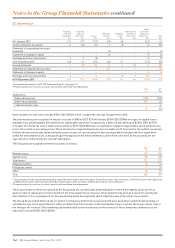
21. Financial risk management continued
Liquidity risk
The following are the undiscounted contractual cash flows of financial liabilities, including interest payments:
Less than
1 year
$m
Between 1 and
2 years
$m
Between 2 and
5 years
$m
More than
5 years
$m
Total
$m
31 December 2013
Non-derivative financial liabilities:
Secured bank loans –4––4
£250m 6% bonds 2016 25 25 438 –488
£400m 3.875% bonds 2022 26 26 77 764 893
Finance lease obligations 16 16 48 3,300 3,380
Trade and other payables 748 162 193 289 1,392
Provisions 3–––3
Derivative financial liabilities:
Forward foreign exchange contracts (1) – – – (1)
Currency swaps – outflows 26 26 441 –493
– inflows (25) (25) (438) –(488)
Less than
1 year
$m
Between 1 and
2 years
$m
Between 2 and
5 years
$m
More than
5 years
$m
Total
$m
31 December 2012
Non-derivative financial liabilities:
Secured bank loans – – 5 – 5
£250m 6% bonds 2016 24 24 453 –501
£400m 3.875% bonds 2022 25 25 75 772 897
Finance lease obligations 16 16 48 3,316 3,396
Trade and other payables 709 154 191 285 1,339
Provisions 11––2
Derivative financial liabilities:
Forward foreign exchange contracts (2) – – – (2)
Currency swaps – outflows 26 26 467 –519
– inflows (24) (24) (453) –(501)
Credit risk
The carrying amount of financial assets represents the maximum exposure to credit risk.
2013
$m
2012
$m
Cash and cash equivalents 134 195
Equity securities available-for-sale 136 112
Derivative financial instruments 12
Loans and receivables:
Other financial assets 112 49
Trade and other receivables, excluding prepayments 358 362
741 720
Notes to the Group Financial Statements 137
OVERVIEW STRATEGIC REPORT GOVERNANCE
GROUP
FINANCIAL STATEMENTS
PARENT COMPANY
FINANCIAL STATEMENTS ADDITIONAL INFORMATION