Holiday Inn 2013 Annual Report Download - page 146
Download and view the complete annual report
Please find page 146 of the 2013 Holiday Inn annual report below. You can navigate through the pages in the report by either clicking on the pages listed below, or by using the keyword search tool below to find specific information within the annual report.-
 1
1 -
2
-
3
-
4
-
5
-
6
-
7
-
8
-
9
-
10
-
11
-
12
-
13
-
14
-
15
-
16
-
17
-
18
-
19
-
20
-
21
-
22
-
23
-
24
-
25
-
26
-
27
-
28
-
29
-
30
-
31
-
32
-
33
-
34
-
35
-
36
-
37
-
38
-
39
-
40
-
41
-
42
-
43
-
44
-
45
-
46
-
47
-
48
-
49
-
50
-
51
-
52
-
53
-
54
-
55
-
56
-
57
-
58
-
59
-
60
-
61
-
62
-
63
-
64
-
65
-
66
-
67
-
68
-
69
-
70
-
71
-
72
-
73
-
74
-
75
-
76
-
77
-
78
-
79
-
80
-
81
-
82
-
83
-
84
-
85
-
86
-
87
-
88
-
89
-
90
-
91
-
92
-
93
-
94
-
95
-
96
-
97
-
98
-
99
-
100
-
101
-
102
-
103
-
104
-
105
-
106
-
107
-
108
-
109
-
110
-
111
-
112
-
113
-
114
-
115
-
116
-
117
-
118
-
119
-
120
-
121
-
122
-
123
-
124
-
125
-
126
-
127
-
128
-
129
-
130
-
131
-
132
-
133
-
134
-
135
-
 136
136 -
 137
137 -
 138
138 -
 139
139 -
 140
140 -
 141
141 -
 142
142 -
 143
143 -
 144
144 -
 145
145 -
 146
146 -
 147
147 -
 148
148 -
 149
149 -
 150
150 -
 151
151 -
 152
152 -
 153
153 -
 154
154 -
 155
155 -
 156
156 -
157
-
158
-
159
-
160
-
161
-
162
-
163
-
164
-
165
-
166
-
167
-
168
-
169
-
170
-
171
-
172
-
173
-
174
-
175
-
176
-
177
-
178
-
179
-
180
-
181
-
182
-
183
-
184
-
185
-
186
-
187
-
188
-
189
-
190
-
191
-
192
 |
 |

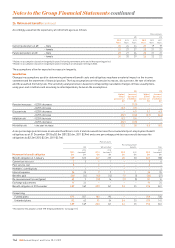
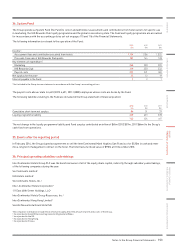
26. Retirement benefits continued
Accordingly, assumed life expectancy at retirement age is as follows:
Pension plans
UK US
2013
Years
2012
Years
2011
Years
2013
Years
2012
Years
2011
Years
Current pensioners at 651 – male 24 24 24 21 19 19
– female 27 27 27 23 21 21
Future pensioners at 652 – male 27 27 26 22 21 21
– female 30 30 29 25 22 22
1
Relates to assumptions based on longevity (in years) following retirement at the end of the reporting period.
2
Relates to assumptions based on longevity (in years) relating to an employee retiring in 2033.
The assumptions allow for expected increases in longevity.
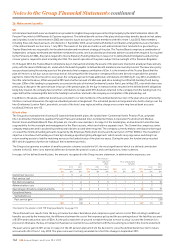
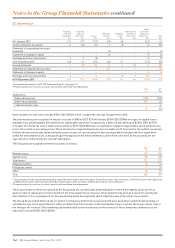
Sensitivities
Changes in assumptions used for determining retirement benefit costs and obligations may have a material impact on the income
statement and the statement of financial position. The key assumptions are the pension increases, discount rate, the rate of inflation
and the assumed mortality rate. The sensitivity analysis below is based on extrapolating reasonable changes in these assumptions,
using year-end conditions and assuming no interdependency between the assumptions.
UK US
Higher/
(lower)
pension cost
$m
Increase/
(decrease)
in liabilities
$m
Higher/
(lower)
pension cost
$m
Increase/
(decrease)
in liabilities
$m
Pension increases – 0.25% decrease –(2.3) – –
– 0.25% increase 0.2 3.0 – –
Discount rate – 0.25% decrease –4.0 0.1 6.3
– 0.25% increase (0.2) (3.6) (0.1) (6.6)
Inflation rate – 0.25% increase 0.2 3.6 – –
– 0.25% decrease (0.2) (3.0) – –
Mortality rate – one year increase 0.2 1.8 0.3 8.0
A one percentage point increase in assumed healthcare costs trend rate would increase the accumulated post-employment benefit
obligations as at 31 December 2013 by $2.8m (2012 $2.6m, 2011 $2.9m) and a one percentage point decrease would decrease the
obligations by $2.3m (2012 $2.3m, 2011 $2.7m).
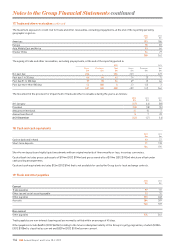
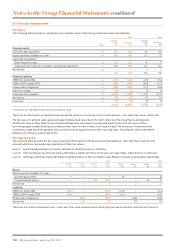
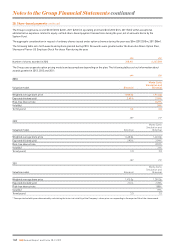
Pension plans
UK US and other
Post-employment
benefits Total
Movement in benefit obligation 2013
$m
2012
(restated1)
$m
2013
$m
2012
(restated1)
$m
2013
$m
2012
$m
2013
$m
2012
(restated1)
$m
Benefit obligation at 1 January 569 525 247 233 25 30 841 788
Current service cost 2511––36
Past service cost 5–1–––6–
Members’ contributions –1–––––1
Interest expense 26 25 791134 35
Benefits paid (22) (14) (13) (12) (1) (1) (36) (27)
Re-measurement losses/(gains) 62 3(10) 16 (1) (5) 51 14
Exchange adjustments 17 24 ––––17 24
Benefit obligation at 31 December 659 569 233 247 24 25 916 841
Comprising:
Funded plans 577 507 182 193 ––759 700
Unfunded plans 82 62 51 54 24 25 157 141
659 569 233 247 24 25 916 841
1 Restated for the adoption of IAS 19R ‘Employee Benefits’ (see page 111).
144 IHG Annual Report and Form 20-F 2013
Notes to the Group Financial Statements continued