Holiday Inn 2013 Annual Report Download - page 42
Download and view the complete annual report
Please find page 42 of the 2013 Holiday Inn annual report below. You can navigate through the pages in the report by either clicking on the pages listed below, or by using the keyword search tool below to find specific information within the annual report.-
 1
1 -
2
-
3
-
4
-
5
-
6
-
7
-
8
-
9
-
10
-
11
-
12
-
13
-
14
-
15
-
16
-
17
-
18
-
19
-
20
-
21
-
22
-
23
-
24
-
25
-
26
-
27
-
28
-
29
-
30
-
31
-
 32
32 -
 33
33 -
 34
34 -
 35
35 -
 36
36 -
 37
37 -
 38
38 -
 39
39 -
 40
40 -
 41
41 -
 42
42 -
 43
43 -
 44
44 -
 45
45 -
 46
46 -
 47
47 -
 48
48 -
 49
49 -
 50
50 -
 51
51 -
 52
52 -
53
-
54
-
55
-
56
-
57
-
58
-
59
-
60
-
61
-
62
-
63
-
64
-
65
-
66
-
67
-
68
-
69
-
70
-
71
-
72
-
73
-
74
-
75
-
76
-
77
-
78
-
79
-
80
-
81
-
82
-
83
-
84
-
85
-
86
-
87
-
88
-
89
-
90
-
91
-
92
-
93
-
94
-
95
-
96
-
97
-
98
-
99
-
100
-
101
-
102
-
103
-
104
-
105
-
106
-
107
-
108
-
109
-
110
-
111
-
112
-
113
-
114
-
115
-
116
-
117
-
118
-
119
-
120
-
121
-
122
-
123
-
124
-
125
-
126
-
127
-
128
-
129
-
130
-
131
-
132
-
133
-
134
-
135
-
136
-
137
-
138
-
139
-
140
-
141
-
142
-
143
-
144
-
145
-
146
-
147
-
148
-
149
-
150
-
151
-
152
-
153
-
154
-
155
-
156
-
157
-
158
-
159
-
160
-
161
-
162
-
163
-
164
-
165
-
166
-
167
-
168
-
169
-
170
-
171
-
172
-
173
-
174
-
175
-
176
-
177
-
178
-
179
-
180
-
181
-
182
-
183
-
184
-
185
-
186
-
187
-
188
-
189
-
190
-
191
-
192
 |
 |

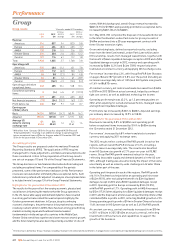
Accounting principles
The Group results are prepared under International Financial
Reporting Standards (IFRS). The application of IFRS requires
management to make judgements, estimates and assumptions and
those considered critical to the preparation of the Group results
are set out on pages 115 and 116 of the Group Financial Statements.
The Group discloses certain financial information both including and
excluding exceptional items. For comparability of the periods
presented, some of the performance indicators in this Performance
review are calculated after eliminating these exceptional items. Such
indicators are prefixed with ‘adjusted’. An analysis of exceptional items
is included in note 5 on page 124 of the Group Financial Statements.
Highlights for the year ended 31 December 2013
The results for the year reflect the varying economic, physical and
social factors influencing the markets that the Group operates in.
In the US, favourable supply and demand dynamics have resulted
in a strong performance albeit this was tempered slightly by the
October government shutdown. In Europe, despite continuing
economic challenges, the performance in key markets has remained
relatively resilient whilst in AMEA there has been strong growth in key
markets including Japan and Southeast Asia but weaker
fundamentals in India and specific countries in the Middle East.
Greater China overall has experienced slower macroeconomic growth
and the hotel industry has also been impacted by a number of one-off
*
Fee revenue is defined as Group revenue excluding revenue from owned and leased hotels, managed leases and significant liquidated damages at constant currency.
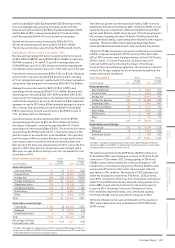
Group results 12 months ended 31 December
2013
$m
20121
$m
2013 vs
2012 %
change
20111
$m
2012 vs
2011 %
change
Revenue
Americas 916 837 9.4 830 0.8
Europe 400 436 (8.3) 405 7.7
AMEA 230 218 5.5 216 0.9
Greater China 236 230 2.6 205 12.2
Central 121 114 6.1 112 1.8
Total 1,903 1,835 3.7 1,768 3.8
Operating profit
Americas 550 486 13.2 451 7.8
Europe 105 112 (6.3) 100 12.0
AMEA 86 88 (2.3) 84 4.8
Greater China 82 81 1.2 67 20.9
Central (155) (162) 4.3 (154) (5.2)
Operating profit before
exceptional items 668 605 10.4 548 10.4
Exceptional operating
items 5(4) n/a 57 (107.0)
673 601 12.0 605 (0.7)
Net financial expenses (73) (54) (35.2) (62) 12.9
Profit before tax 600 547 9.7 543 0.7
Earnings per
ordinaryshare
Basic 140.9¢ 187.1¢ (24.7) 160.9¢ 16.3
Adjusted 158.3¢ 139.0¢ 13.9 127.7¢8.8
Average US
dollar to sterling
exchange rate
$1:
£0.64
$1:
£0.63 1.6 $1:
£0.62 1.6
1
With effect from 1 January 2013 the Group has adopted IASI9 (Revised)
‘Employee Benefits’ resulting in an additional charge to operating profit
before exceptional items of $9m for the year ended 31 December 2012 and
$11m for the year ended 31 December 2011.
events. With this background, overall Group revenue increased by
$68m (3.7%) to $1,903m and operating profit before exceptional items
increased by $63m (10.4%) to $668m.
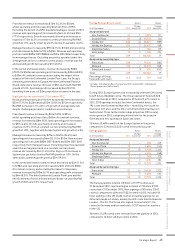
On 1 May 2013, IHG completed the disposal of its leasehold interest
in the InterContinental London Park Lane for gross proceeds of
$469m and entered into a 30-year management contract with
three 10-year extension rights.
On an underlying basis, defined as reported results, excluding
those from the InterContinental London Park Lane whilst under
IHG ownership, results from managed leased hotels, together with
the benefit of $46m liquidated damages receipts in 2013 and a $3m
liquidated damages receipt in 2012, revenue and operating profit
increased by $68m (4.2%) and $44m (7.8%) respectively when
translated at constant currency and applying 2012 exchange rates.
Fee revenue* increased by 4.3%, with Group RevPAR (see Glossary
on pages 186 and 187) growth of 3.8% over the period (including an
increase in average daily rate of 1.8%) and IHG System size growth
of 1.6% to 686,873 rooms.
At constant currency, net central overheads decreased from $162m
to $157m in 2013 ($155m at actual currency), helped by continued
tight cost control, as well as additional technology fee income.
Operating profit margin was 43.2%, up 1.3 percentage points on
2012, after adjusting for owned and leased hotels, managed leases
and significant liquidated damages.
Profit before tax increased by $53m to $600m. Adjusted earnings
per ordinary share increased by 13.9% to 158.3¢.
Highlights for the year ended 31 December 2012
Revenue increased by 3.8% to $1,835m and operating profit
before exceptional items increased by 10.4% to $605m during
the 12 months ended 31 December 2012.
Fee revenue*, increased by 6.8% when translated at constant
currency and applying 2011 exchange rates.
The 2012 results reflect continued RevPAR growth in each of the
regions, with an overall RevPAR increase of 5.2%, including a
3.2% increase in average daily rate. The results also benefited
from IHG System size growth of 2.7% year–on–year to 675,982
rooms. Group RevPAR growth remained robust for the year,
reflecting favourable supply and demand dynamics in the US over
2011, although trading was also affected by the impact of Eurozone
uncertainty as well as industry–wide challenges in Greater China
in the latter part of the year.
Operating profit improved in each of the regions. RevPAR growth
of6.1% in The Americas helped drive an operating profit increase
of$42m (9.5%), after excluding the benefit of a $3m liquidated
damages receipt in 2012 and a $10m liquidated damages receipt
in2011. Operating profit in Europe increased by $12m (12.0%),
withRevPAR growth of 1.7%. Operating profit in AMEA increased
by$13m (17.3%) after adjusting for a $6m liquidated damages receipt
in 2011 and the disposal of a hotel asset and partnership interest that
contributed $3m in profits in 2011, reflecting RevPAR growth of 4.9%.
Strong operating profit growth of $14m in Greater China reflected an
11.6% increase in IHG System size as well as 5.4% RevPAR growth.
At constant currency, central overheads increased from $154m
in 2011 to $164m in 2012 ($162m at actual currency), reflecting
investment in infrastructure and capabilities to support the
growth of the business.
40 IHG Annual Report and Form 20-F 2013
Performance
Group