Holiday Inn 2013 Annual Report Download - page 55
Download and view the complete annual report
Please find page 55 of the 2013 Holiday Inn annual report below. You can navigate through the pages in the report by either clicking on the pages listed below, or by using the keyword search tool below to find specific information within the annual report.-
 1
1 -
2
-
3
-
4
-
5
-
6
-
7
-
8
-
9
-
10
-
11
-
12
-
13
-
14
-
15
-
16
-
17
-
18
-
19
-
20
-
21
-
22
-
23
-
24
-
25
-
26
-
27
-
28
-
29
-
30
-
31
-
32
-
33
-
34
-
35
-
36
-
37
-
38
-
39
-
40
-
41
-
42
-
43
-
44
-
 45
45 -
 46
46 -
 47
47 -
 48
48 -
 49
49 -
 50
50 -
 51
51 -
 52
52 -
 53
53 -
 54
54 -
 55
55 -
 56
56 -
 57
57 -
 58
58 -
 59
59 -
 60
60 -
 61
61 -
 62
62 -
 63
63 -
 64
64 -
 65
65 -
66
-
67
-
68
-
69
-
70
-
71
-
72
-
73
-
74
-
75
-
76
-
77
-
78
-
79
-
80
-
81
-
82
-
83
-
84
-
85
-
86
-
87
-
88
-
89
-
90
-
91
-
92
-
93
-
94
-
95
-
96
-
97
-
98
-
99
-
100
-
101
-
102
-
103
-
104
-
105
-
106
-
107
-
108
-
109
-
110
-
111
-
112
-
113
-
114
-
115
-
116
-
117
-
118
-
119
-
120
-
121
-
122
-
123
-
124
-
125
-
126
-
127
-
128
-
129
-
130
-
131
-
132
-
133
-
134
-
135
-
136
-
137
-
138
-
139
-
140
-
141
-
142
-
143
-
144
-
145
-
146
-
147
-
148
-
149
-
150
-
151
-
152
-
153
-
154
-
155
-
156
-
157
-
158
-
159
-
160
-
161
-
162
-
163
-
164
-
165
-
166
-
167
-
168
-
169
-
170
-
171
-
172
-
173
-
174
-
175
-
176
-
177
-
178
-
179
-
180
-
181
-
182
-
183
-
184
-
185
-
186
-
187
-
188
-
189
-
190
-
191
-
192
 |
 |

Off-sheet balance sheet arrangements
At 31 December 2013, the Group had no off-balance sheet
arrangements that have or are reasonably likely to have a current
or future effect on the Group’s financial condition, revenues or
expenses, results of operations, liquidity, capital expenditures or
capital resources that is material to investors.
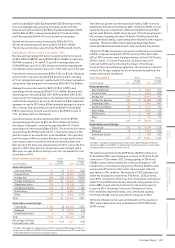
Contractual obligations
The Group had the following contractual obligations outstanding as
of 31 December 2013:
Total
amounts
committed
Less
than
1 year
1-3
years
3-5
years
After 5
years
$m
Long-term debt
obligations1, 2 1,080 –419 –661
Interest payable2308 52 103 51 102
Finance lease
obligations33,380 16 32 32 3,300
Operating lease
obligations 352 42 62 46 202
Agreed pension
scheme
contributions4
12 12 –––
Capital contracts
placed 83 83 –––
Total 5,215 205 616 129 4,265
1 Repayment period classified according to the related bond maturity date.
2 Including the impact of derivatives.
3
Represents the minimum lease payments related to the 99-year lease
(of which 92 years remain) on the InterContinental Boston. Payments under
the lease step up at regular intervals over the lease term.
4 Largely relates to US pension obligations.
As explained in note 26 to the Group Financial Statements,
the Group completed a buy-in of its UK defined benefit obligations
on 15 August 2013. As a result of this transaction, the defined
benefit section of the UK plan is now fully funded and the Company
therefore has no further contributions to make in respect of
this obligation.
Contingent liabilities
Contingent liabilities include performance guarantees with possible
cash outflows totalling $48m, guarantees over the debt of equity
investments of $20m and outstanding letters of credit of $41m.
See note 32 to the Group Financial Statements for further details.
The Group’s risk management policies and additional information
regarding the financial intstruments used are included in notes 21,
22, 23 and 24 of the Group Financial Statements.
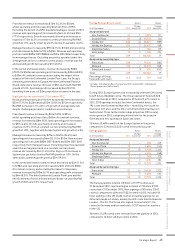
The following table provides information about the Group’s
borrowings and derivatives and their sensitivity to interest rates,
although at both 31 December 2013 and 31 December 2012, 100% of
borrowings in major currencies were fixed rate debt due to the low
interest rate environment and current profile of the Group’s debt.
For long-term borrowings the table presents the debt principals
and related weighted average interest rates by expected maturity
dates. For currency swaps, the table presents notional amounts
and weighted average interest rates by expected maturity dates.
Weighted average variable rates are based on rates set on the last
day of the period. The actual currencies of the debt principals are
indicated in parentheses.
Expected to mature before 31 December
2014 2015 2016 2017 Thereafter Total
Fair
value of
liability
(local currency million, except percentages)
Long term debt
Fixed rate
public
bonds
(Sterling)
– – 250 –400 650 671
Average
fixed rate
payable
– – 6.0% –3.9% 4.7% –
Fixed rate
lease debt
(US dollar)
– – – – 215 215 233
Fixed rate
payable – – – – 9.7% 9.7% –
Variable
rate bank
debt (NZ
dollar)
– 5 – – – 5 5
Variable
interest
rate
payable
–4.7% – – – 4.7% –
Currency swaps
Principal
received
(Sterling)
– – 250 – – 250 –
Fixed rate
payable – – 6.0% – – 6.0% –
Principal
paid (US
dollar)
– – 415 – – 415 11
Fixed rate
payable – – 6.2% – – 6.2% –
Market risk
disclosures
Strategic Report 53
OVERVIEW STRATEGIC REPORT GOVERNANCE
GROUP
FINANCIAL STATEMENTS
PARENT COMPANY
FINANCIAL STATEMENTS ADDITIONAL INFORMATION