Holiday Inn 2013 Annual Report Download - page 124
Download and view the complete annual report
Please find page 124 of the 2013 Holiday Inn annual report below. You can navigate through the pages in the report by either clicking on the pages listed below, or by using the keyword search tool below to find specific information within the annual report.-
 1
1 -
2
-
3
-
4
-
5
-
6
-
7
-
8
-
9
-
10
-
11
-
12
-
13
-
14
-
15
-
16
-
17
-
18
-
19
-
20
-
21
-
22
-
23
-
24
-
25
-
26
-
27
-
28
-
29
-
30
-
31
-
32
-
33
-
34
-
35
-
36
-
37
-
38
-
39
-
40
-
41
-
42
-
43
-
44
-
45
-
46
-
47
-
48
-
49
-
50
-
51
-
52
-
53
-
54
-
55
-
56
-
57
-
58
-
59
-
60
-
61
-
62
-
63
-
64
-
65
-
66
-
67
-
68
-
69
-
70
-
71
-
72
-
73
-
74
-
75
-
76
-
77
-
78
-
79
-
80
-
81
-
82
-
83
-
84
-
85
-
86
-
87
-
88
-
89
-
90
-
91
-
92
-
93
-
94
-
95
-
96
-
97
-
98
-
99
-
100
-
101
-
102
-
103
-
104
-
105
-
106
-
107
-
108
-
109
-
110
-
111
-
112
-
113
-
 114
114 -
 115
115 -
 116
116 -
 117
117 -
 118
118 -
 119
119 -
 120
120 -
 121
121 -
 122
122 -
 123
123 -
 124
124 -
 125
125 -
 126
126 -
 127
127 -
 128
128 -
 129
129 -
 130
130 -
 131
131 -
 132
132 -
 133
133 -
 134
134 -
135
-
136
-
137
-
138
-
139
-
140
-
141
-
142
-
143
-
144
-
145
-
146
-
147
-
148
-
149
-
150
-
151
-
152
-
153
-
154
-
155
-
156
-
157
-
158
-
159
-
160
-
161
-
162
-
163
-
164
-
165
-
166
-
167
-
168
-
169
-
170
-
171
-
172
-
173
-
174
-
175
-
176
-
177
-
178
-
179
-
180
-
181
-
182
-
183
-
184
-
185
-
186
-
187
-
188
-
189
-
190
-
191
-
192
 |
 |

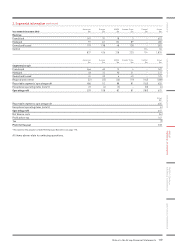
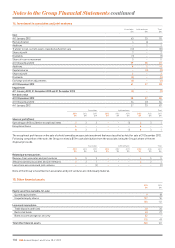
2. Segmental information continued
Geographical information
Year ended
31 December
2013
$m
Year ended
31 December
2012
$m
Year ended
31 December
2011
$m
Revenue
United Kingdom 90 152 139
United States 843 769 740
People’s Republic of China (including Hong Kong) 247 238 210
Rest of World 723 676 679
1,903 1,835 1,768
For the purposes of the above table, hotel revenue is determined according to the location of the hotel and other revenue is attributed
to the country of origin. In addition to the United Kingdom, revenue relating to an individual country is separately disclosed when it
represents 10% or more of total revenue.
31 December
2013
$m
31 December
2012
$m
31 December
2011
$m
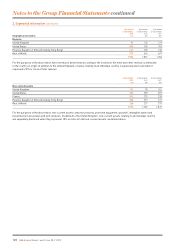
Non-current assets
United Kingdom 131 78 361
United States 705 590 559
France 342 329 328
People’s Republic of China (including Hong Kong) 326 333 331
Rest of World 268 257 270
1,772 1,587 1,849
For the purposes of the above table, non-current assets comprise property, plant and equipment, goodwill, intangible assets and
investments in associates and joint ventures. In addition to the United Kingdom, non-current assets relating to an individual country
are separately disclosed when they represent 10% or more of total non-current assets, as defined above.
122 IHG Annual Report and Form 20-F 2013
Notes to the Group Financial Statements continued