Holiday Inn 2013 Annual Report Download - page 50
Download and view the complete annual report
Please find page 50 of the 2013 Holiday Inn annual report below. You can navigate through the pages in the report by either clicking on the pages listed below, or by using the keyword search tool below to find specific information within the annual report.-
 1
1 -
2
-
3
-
4
-
5
-
6
-
7
-
8
-
9
-
10
-
11
-
12
-
13
-
14
-
15
-
16
-
17
-
18
-
19
-
20
-
21
-
22
-
23
-
24
-
25
-
26
-
27
-
28
-
29
-
30
-
31
-
32
-
33
-
34
-
35
-
36
-
37
-
38
-
39
-
 40
40 -
 41
41 -
 42
42 -
 43
43 -
 44
44 -
 45
45 -
 46
46 -
 47
47 -
 48
48 -
 49
49 -
 50
50 -
 51
51 -
 52
52 -
 53
53 -
 54
54 -
 55
55 -
 56
56 -
 57
57 -
 58
58 -
 59
59 -
 60
60 -
61
-
62
-
63
-
64
-
65
-
66
-
67
-
68
-
69
-
70
-
71
-
72
-
73
-
74
-
75
-
76
-
77
-
78
-
79
-
80
-
81
-
82
-
83
-
84
-
85
-
86
-
87
-
88
-
89
-
90
-
91
-
92
-
93
-
94
-
95
-
96
-
97
-
98
-
99
-
100
-
101
-
102
-
103
-
104
-
105
-
106
-
107
-
108
-
109
-
110
-
111
-
112
-
113
-
114
-
115
-
116
-
117
-
118
-
119
-
120
-
121
-
122
-
123
-
124
-
125
-
126
-
127
-
128
-
129
-
130
-
131
-
132
-
133
-
134
-
135
-
136
-
137
-
138
-
139
-
140
-
141
-
142
-
143
-
144
-
145
-
146
-
147
-
148
-
149
-
150
-
151
-
152
-
153
-
154
-
155
-
156
-
157
-
158
-
159
-
160
-
161
-
162
-
163
-
164
-
165
-
166
-
167
-
168
-
169
-
170
-
171
-
172
-
173
-
174
-
175
-
176
-
177
-
178
-
179
-
180
-
181
-
182
-
183
-
184
-
185
-
186
-
187
-
188
-
189
-
190
-
191
-
192
 |
 |

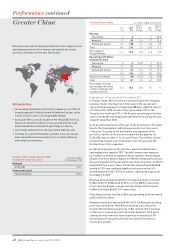
Greater China results 12 months ended 31 December
2013
$m
2012
$m
2013 vs
2012 %
change
2011
$m
2012 vs
2011 %
change
Revenue
Franchised 33– 2 50.0
Managed 92 89 3.4 77 15.6
Owned and leased 141 138 2.2 126 9.5
Total 236 230 2.6 205 12.2
Percentage of
Group Revenue 12.4 12.5 (0.1) 11.6 0.9
Operating profit before
exceptional items
Franchised 5425.0 333.3
Managed 51 51 –43 18.6
Owned and leased 47 45 4.4 37 21.6
103 100 3.0 83 20.5
Regional overheads (21) (19) (10.5) (16) (18.8)
Total 82 81 1.2 67 20.9
Percentage of Group
Operating profit before
central overheads and
exceptional items
10.0 10.6 (0.6) 9.5 1.1
Highlights for the year ended 31December 2013
In Greater China, 96% of rooms are operated under the managed
business model. The majority of hotels are in the upscale and
upper midscale segments. Comprising 208 hotels (68,545 rooms)
at 31December 2013, Greater China represented 10% of the
Group’s room count and 10% of the Group’s operating profit before
central overheads and exceptional operating items during the year
ended 31December 2013.
Good progress was made in the year on the priorities for the region
despite the challenging conditions experienced over the course
of the year. Focusing on the distribution and expansion of the
portfolio, a further six hotels were signed into the pipeline for
HUALUXE and a further 11 for Crowne Plaza. The number of open
Crowne Plaza hotels also increased by five in the year and the
Holiday Inn portfolio expanded.
Despite good progress on the priorities, market conditions were
challenging in the region in 2013. The hotel industry was impacted
by a number of factors including the China-Japan territorial islands
dispute, a series of natural disasters in Western China, particularly in
the second quarter of the year, and slower macroeconomic conditions
during 2013 than in prior years. Overall the region achieved RevPAR
growth of 1.0% representing a significant decrease on the 5.4%
growth achieved in 2012. IHG did, however, significantly outperform
the industry in 2013.
Revenue and operating profit before exceptional items increased
by$6m (2.6%) to $236m and by $1m (1.2%) to $82m respectively.
On an underlying basis, revenue and operating profit increased
by $6m (2.6%) and $2m (2.5%) respectively.
Franchised revenue was flat at $3m and operating profit increased
by $1m (25.0%) to $5m.
Managed revenue increased by $3m (3.4%) to $92m and operating
profit was flat at $51m. RevPAR increased by 0.6%, whilst the
Greater China System size grew by 11.8%, driving a 9.2% increase
in total gross revenue derived from rooms business. Total gross
revenue derived from non-rooms business increased by 3.0%.
Operating profit was partly offset by increased investment to
drive future growth.
2014 priorities
• Grow quality distribution and further expand our portfolio of
brands especially Holiday Inn and Holiday Inn Express in tier
2 and 3 cities to cater to evolving market needs;
• build upon the successful launch of the HUALUXE Hotels &
Resorts brand and continue to drive growth and fine-tune
brand standards and standard operating procedures;
• grow talent and build a strong local talent pipeline; and
• continue to localise IHG brands, systems, tools, processes
and responsible business practices to increase efficiency
and margin performance.
Maximise scale and strength and establish multi-segment local
operating expertise to drive margin and expand our strong
portfolio of brands over the next three years.
Greater China comparable RevPAR
movement on previous year 12 months ended
31December2013
Managed
All brands 0.6%
Owned and leased
InterContinental (0.1)%
Performance continued
48 IHG Annual Report and Form 20-F 2013
Greater China