Holiday Inn 2013 Annual Report Download - page 54
Download and view the complete annual report
Please find page 54 of the 2013 Holiday Inn annual report below. You can navigate through the pages in the report by either clicking on the pages listed below, or by using the keyword search tool below to find specific information within the annual report.-
 1
1 -
2
-
3
-
4
-
5
-
6
-
7
-
8
-
9
-
10
-
11
-
12
-
13
-
14
-
15
-
16
-
17
-
18
-
19
-
20
-
21
-
22
-
23
-
24
-
25
-
26
-
27
-
28
-
29
-
30
-
31
-
32
-
33
-
34
-
35
-
36
-
37
-
38
-
39
-
40
-
41
-
42
-
43
-
 44
44 -
 45
45 -
 46
46 -
 47
47 -
 48
48 -
 49
49 -
 50
50 -
 51
51 -
 52
52 -
 53
53 -
 54
54 -
 55
55 -
 56
56 -
 57
57 -
 58
58 -
 59
59 -
 60
60 -
 61
61 -
 62
62 -
 63
63 -
 64
64 -
65
-
66
-
67
-
68
-
69
-
70
-
71
-
72
-
73
-
74
-
75
-
76
-
77
-
78
-
79
-
80
-
81
-
82
-
83
-
84
-
85
-
86
-
87
-
88
-
89
-
90
-
91
-
92
-
93
-
94
-
95
-
96
-
97
-
98
-
99
-
100
-
101
-
102
-
103
-
104
-
105
-
106
-
107
-
108
-
109
-
110
-
111
-
112
-
113
-
114
-
115
-
116
-
117
-
118
-
119
-
120
-
121
-
122
-
123
-
124
-
125
-
126
-
127
-
128
-
129
-
130
-
131
-
132
-
133
-
134
-
135
-
136
-
137
-
138
-
139
-
140
-
141
-
142
-
143
-
144
-
145
-
146
-
147
-
148
-
149
-
150
-
151
-
152
-
153
-
154
-
155
-
156
-
157
-
158
-
159
-
160
-
161
-
162
-
163
-
164
-
165
-
166
-
167
-
168
-
169
-
170
-
171
-
172
-
173
-
174
-
175
-
176
-
177
-
178
-
179
-
180
-
181
-
182
-
183
-
184
-
185
-
186
-
187
-
188
-
189
-
190
-
191
-
192
 |
 |

Cash from operating activities
Net cash from operating activities totalled $624m for the year
ended 31 December 2013 up $152m on the previous year largely
due to increased operating profit before exceptional items of $63m
and a $76m reduction in the payment of the additional company
contributions to the UK pension plan.
Cash flow from operating activities is the principal source of cash
used to fund the ongoing operating expenses, interest payments,
maintenance capital expenditure and normal dividend payments of
the Group. The Group believes that the requirements of its existing
business and future investment can be met from cash generated
internally, disposition of assets and external finance expected to be
available to it.
Cash from investing activities
Net cash inflows due to investing activities totalled $175m,
compared to an outflow of $128m in 2012, reflecting the sale of the
InterContinental London Park Lane for gross proceeds of $469m
during the year. Of these proceeds, $52m has been placed in
ring-fenced bank accounts which are subject to a charge in favour
of the unfunded UK pension arrangements. Capital expenditure on
property plant and equipment of $159m (2012 $44m) included a
significant investment in hotel properties that are in the process
of being converted to the Group’s EVEN Hotels brand.
The Group had committed contractual capital expenditure of $83m
at 31 December 2013 (2012 $81m).
Cash used in financing activities
Net cash used in financing activities totalled $857m, which was
$528m higher than in 2012 as last year the Group raised a net
$533m from new borrowings. Returns to shareholders of $816m,
comprising ordinary dividends, special dividends and share
buybacks, were $30m higher than in 2012. $44m (2012 $84m) was
spent on share purchases in order to fulfil share incentive awards.
Overall net debt increased during the year by $79m to $1,153m at
31 December 2013.
Sources of liquidity
The Group is financed by a $1.07bn syndicated bank facility which
expires in November 2016 (the Syndicated Facility), £250m of public
bonds which are repayable on 9 December 2016 and £400m of public
bonds which are repayable on 28 November 2022. The $1.07bn
Syndicated Facility was undrawn at the year end. The bonds are
issued under the Group’s £750m Medium Term Notes programme.
Short-term borrowing requirements are met from drawings under
bilateral bank facilities. Additional funding is provided by the 99-year
finance lease (of which 92 years remain) on the InterContinental
Boston. In the Group’s opinion, the available facilities are sufficient
for the Group’s present liquidity requirements.
The Syndicated Facility contains two financial covenants; interest
cover and net debt divided by earnings before interest, tax,
depreciation and amortisation. The Group is in compliance with
all of the financial covenants in its loan documents, none of which
is expected to present a material restriction on funding in the
near future.
Net debt of $1,153m and available facilities at 31 December 2013
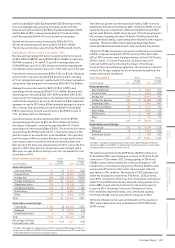
are analysed as follows:
2013
$m
2012
$m
Borrowings
Sterling 654 638
US dollar 629 626
Other 45
Cash and cash equivalents (134) (195)
Net debt11,153 1,074
Average debt levels 985 651
1 Including the impact of currency derivatives.
Facilities at 31 December 2013
$m
2012
$m
Committed 1,074 1,075
Uncommitted 80 96
Total 1,154 1,171
The Group had net liabilities of $74m at 31 December 2013 reflecting
that its brands are not recognised in the Group statement of financial
position. At the end of 2013 the Group was trading significantly within
its banking covenants and facilities.
Performance continued
52 IHG Annual Report and Form 20-F 2013
Liquidity and
capital resources