Holiday Inn 2013 Annual Report Download - page 147
Download and view the complete annual report
Please find page 147 of the 2013 Holiday Inn annual report below. You can navigate through the pages in the report by either clicking on the pages listed below, or by using the keyword search tool below to find specific information within the annual report.-
 1
1 -
2
-
3
-
4
-
5
-
6
-
7
-
8
-
9
-
10
-
11
-
12
-
13
-
14
-
15
-
16
-
17
-
18
-
19
-
20
-
21
-
22
-
23
-
24
-
25
-
26
-
27
-
28
-
29
-
30
-
31
-
32
-
33
-
34
-
35
-
36
-
37
-
38
-
39
-
40
-
41
-
42
-
43
-
44
-
45
-
46
-
47
-
48
-
49
-
50
-
51
-
52
-
53
-
54
-
55
-
56
-
57
-
58
-
59
-
60
-
61
-
62
-
63
-
64
-
65
-
66
-
67
-
68
-
69
-
70
-
71
-
72
-
73
-
74
-
75
-
76
-
77
-
78
-
79
-
80
-
81
-
82
-
83
-
84
-
85
-
86
-
87
-
88
-
89
-
90
-
91
-
92
-
93
-
94
-
95
-
96
-
97
-
98
-
99
-
100
-
101
-
102
-
103
-
104
-
105
-
106
-
107
-
108
-
109
-
110
-
111
-
112
-
113
-
114
-
115
-
116
-
117
-
118
-
119
-
120
-
121
-
122
-
123
-
124
-
125
-
126
-
127
-
128
-
129
-
130
-
131
-
132
-
133
-
134
-
135
-
136
-
 137
137 -
 138
138 -
 139
139 -
 140
140 -
 141
141 -
 142
142 -
 143
143 -
 144
144 -
 145
145 -
 146
146 -
 147
147 -
 148
148 -
 149
149 -
 150
150 -
 151
151 -
 152
152 -
 153
153 -
 154
154 -
 155
155 -
 156
156 -
 157
157 -
158
-
159
-
160
-
161
-
162
-
163
-
164
-
165
-
166
-
167
-
168
-
169
-
170
-
171
-
172
-
173
-
174
-
175
-
176
-
177
-
178
-
179
-
180
-
181
-
182
-
183
-
184
-
185
-
186
-
187
-
188
-
189
-
190
-
191
-
192
 |
 |

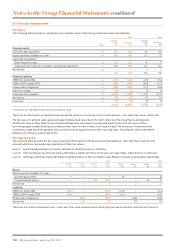
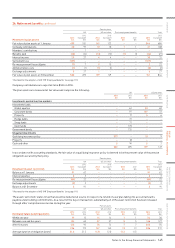
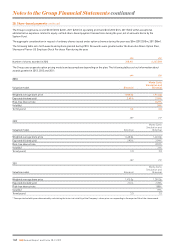
26. Retirement benefits continued
Pension plans
UK US and other Post-employment benefits Total
Movement in plan assets 2013
$m
2012
(restated1)
$m
2013
$m
2012
(restated1)
$m
2013
$m
2012
$m
2013
$m
2012
(restated1)
$m
Fair value of plan assets at 1 January 695 551 149 133 ––844 684
Company contributions 20 97 10 10 1131 108
Members’ contributions –1–––––1
Benefits paid (22) (14) (13) (12) (1) (1) (36) (27)
Interest income 29 27 44––33 31
Settlement loss (137) –––––(137) –
Re-measurement (losses)/gains (7) 7915 ––222
Administration costs (1) (1) (1) (1) ––(2) (2)
Exchange adjustments 527 1–––627
Fair value of plan assets at 31 December 582 695 159 149 ––741 844
1 Restated for the adoption of IAS 19R ‘Employee Benefits’ (see page 111).
Company contributions are expected to be $12m in 2014.
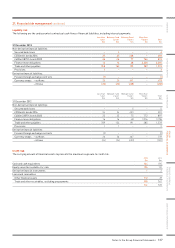
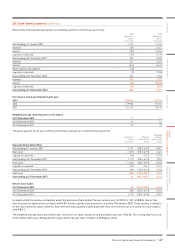
The plan assets are measured at fair value and comprise the following:
UK US and other
2013
$m
2012
$m
2013
$m
2012
$m
Investments quoted in active markets
Investment funds:
Global equities –62 33 60
Corporate bonds –97 107 72
Property –17 46
Hedge funds –31 ––
Swap funds –71 ––
Cash funds –170 ––
Government bonds –135 ––
Unquoted investments
Qualifying insurance policy 577 –10 9
Property –18 ––
Cash and other 594 52
582 695 159 149
In accordance with accounting standards, the fair value of a qualifying insurance policy is deemed to be the present value of the pension
obligations secured by thatpolicy.
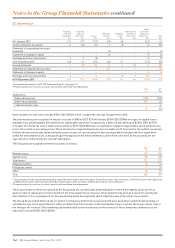
Pension plans
UK US and other Post-employment benefits Total
Movement in asset restriction 2013
$m
2012
(restated1)
$m
2013
$m
2012
(restated1)
$m
2013
$m
2012
$m
2013
$m
2012
(restated1)
$m
Balance at 1 January 91 63 ––––91 63
Interest expense 33––––33
Re-measurement (losses)/gains (89) 23 ––––(89) 23
Exchange adjustments (3) 2––––(3) 2
Balance at 31 December 291 ––––291
1 Restated for the adoption of IAS 19R ‘Employee Benefits’ (see page 111).
The asset restriction relates to tax that would be deducted at source in respect of a refund of a surplus taking into account amounts
payable under funding commitments. As a result of the buy-in transaction, substantially all of the asset restriction has been released
through other comprehensive income during the year.
Pension plans
UK US and other Post-employment benefits Total
Estimated future benefit payments 2013
$m
2012
$m
2013
$m
2012
$m
2013
$m
2012
$m
2013
$m
2012
$m
Within one year 19 15 14 14 1134 30
Between one and five years 84 65 57 57 55146 127
After five years 123 93 76 74 77206 174
226 173 147 145 13 13 386 331
Average duration of obligation (years) 21.6 21.5 11.8 12.0 11.3 11.5
Notes to the Group Financial Statements 145
OVERVIEW STRATEGIC REPORT GOVERNANCE
GROUP
FINANCIAL STATEMENTS
PARENT COMPANY
FINANCIAL STATEMENTS ADDITIONAL INFORMATION